For Lynxmind
As a Checkmk extension developer and enthusiast, and most recently OpenTelemetry Certified, I wanted to put observability into practice on a real-world project.
For Lynxmind
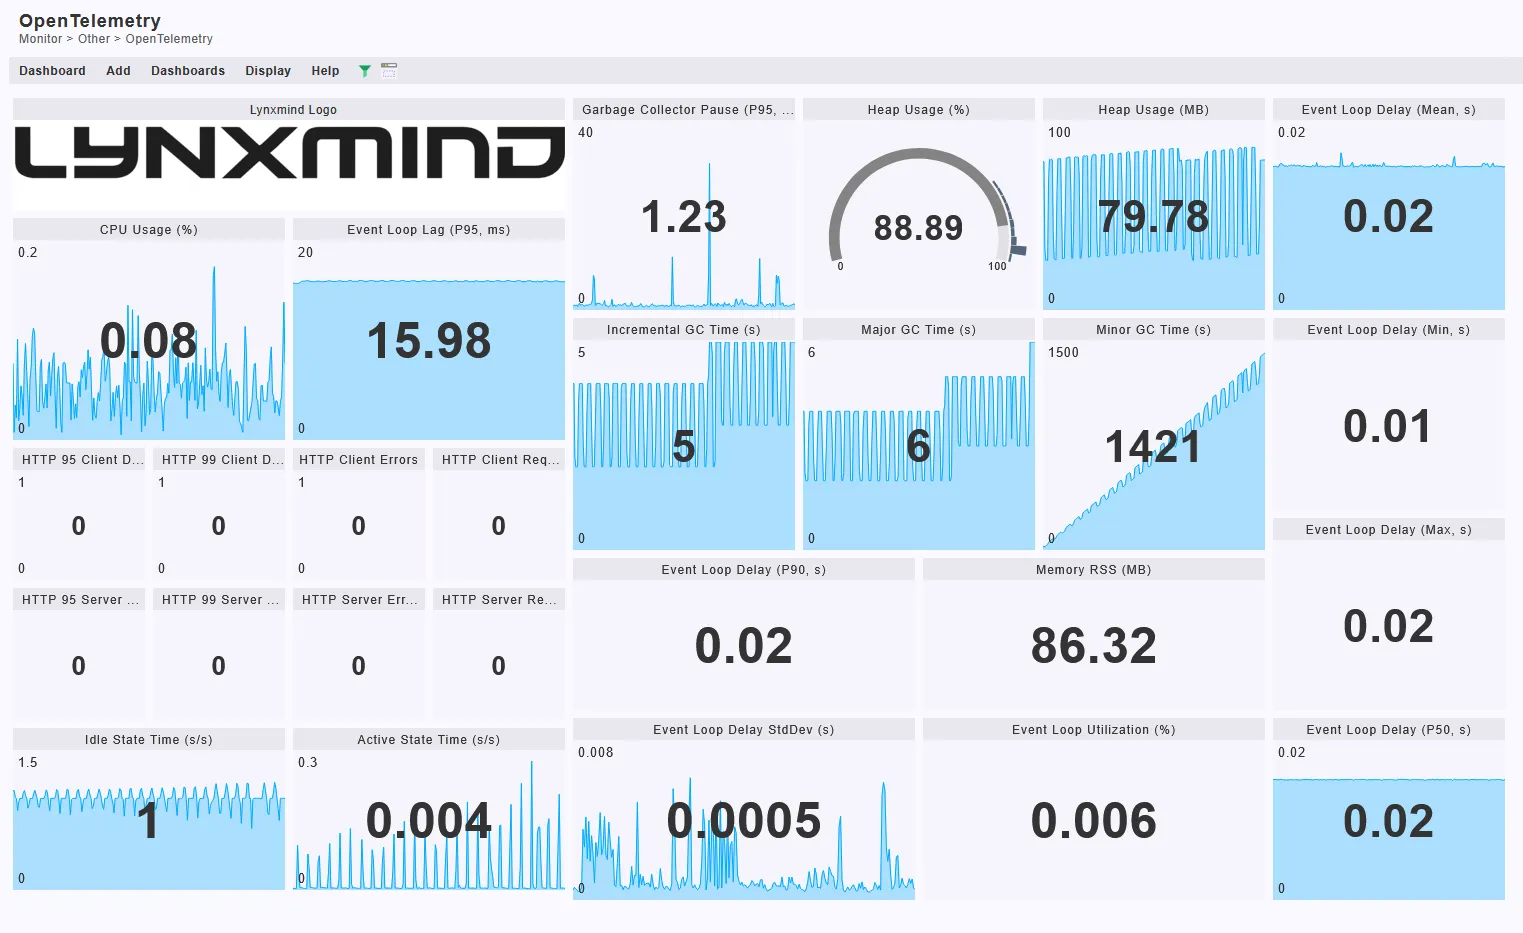
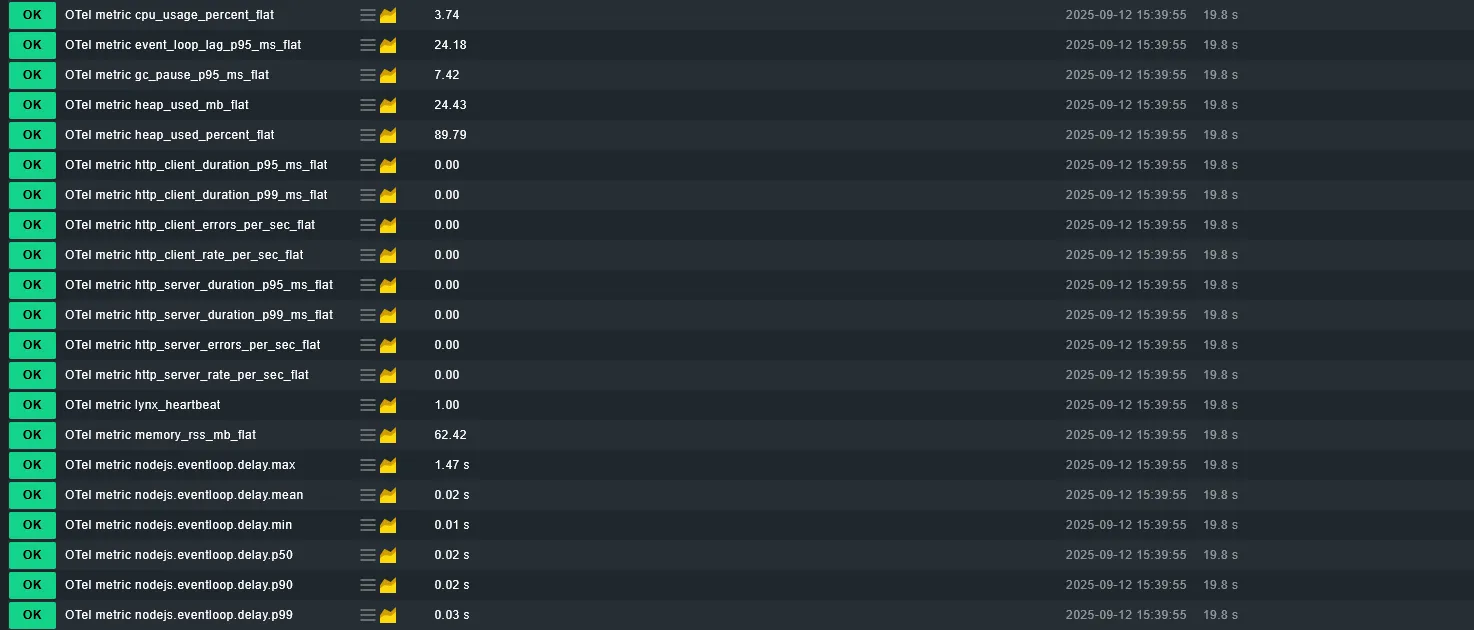
I instrumented our Node.js and Astro stack with the OpenTelemetry SDK and exported metrics into the Checkmk 2.4 OpenTelemetry Collector (OTLP/HTTP). This pipeline was designed to capture essential runtime signals, including CPU usage, memory and heap statistics, garbage collection pauses, event loop latency, and HTTP client/server performance. Using service name mapping with Checkmk’s Dynamic Configuration Daemon (DCD), hosts such as Lynxmind website were created automatically. Custom dashboards in Checkmk then turned this raw telemetry into actionable insights.
The resulting dashboards now provide:
This observability stack delivers tangible value:
With OpenTelemetry and Checkmk we no longer just monitor if Lynxmind

As a DevOps Consultant Trainee at Lynxmind, he is building a strong foundation in automation, CI/CD and cloud infrastructure. With a hands-on approach and a drive to grow, he supports the team in streamlining processes and enhancing system reliability.