The intelligence layer for Checkmk.
Your monitoring already knows something is wrong. Pardinus works out why, with the evidence it used, a confidence score, and a next step that waits for your approval. Inside Checkmk, on the model you choose.
Delivery
A Checkmk MKP. No extension, no second console.
Model
Bring your own. Any OpenAI compatible endpoint.
Actions
Nothing runs without a person pressing Run.
Cost
Token spend tracked per site, user and operation.
The problem
Six alerts. One cause.
A saturated host, a slow database, a failed checkout, and a memory ceiling on a node. Monitoring reports them as independent problems, at 3am, to one person.
Pardinus reads them together, with the history of everything that looked like this before, and returns one investigated incident.
What's in the suite
Nine modules, one add-on
Pardinus started as chat and root cause analysis. It is now the operational layer around them: what to check first, what to run, what to learn, what it costs, and who approves.
Investigate
A verdict with confidence, the Checkmk facts behind it, and the specialist agent that produced it.
Quick Diagnose
A read only playbook per alert type. One known command, raw output, no tokens spent.
Action Path
Suggested remediation you edit, select, and approve. Every run over SSH, every run audited.
Proactive RCA
Analysis that starts the moment a service goes critical, scoped by a normal Checkmk ruleset.
Trend Analysis
Recurring patterns, services that occur together, and tuning candidates, computed before anything is written.
Knowledge Base
Findings become reusable knowledge only when a human approves them, with a note on why it happens.
Configuration Auditor
A risk score for the site: shadowed rules, duplicates, missing thresholds, and general hygiene.
Chat
Ask about the estate from any dashboard, in your language, with per user history.
Health & Finance
Self monitoring and token cost per site, per operation, per user, with month end projection.
Investigate
Every problem, routed to the right specialist
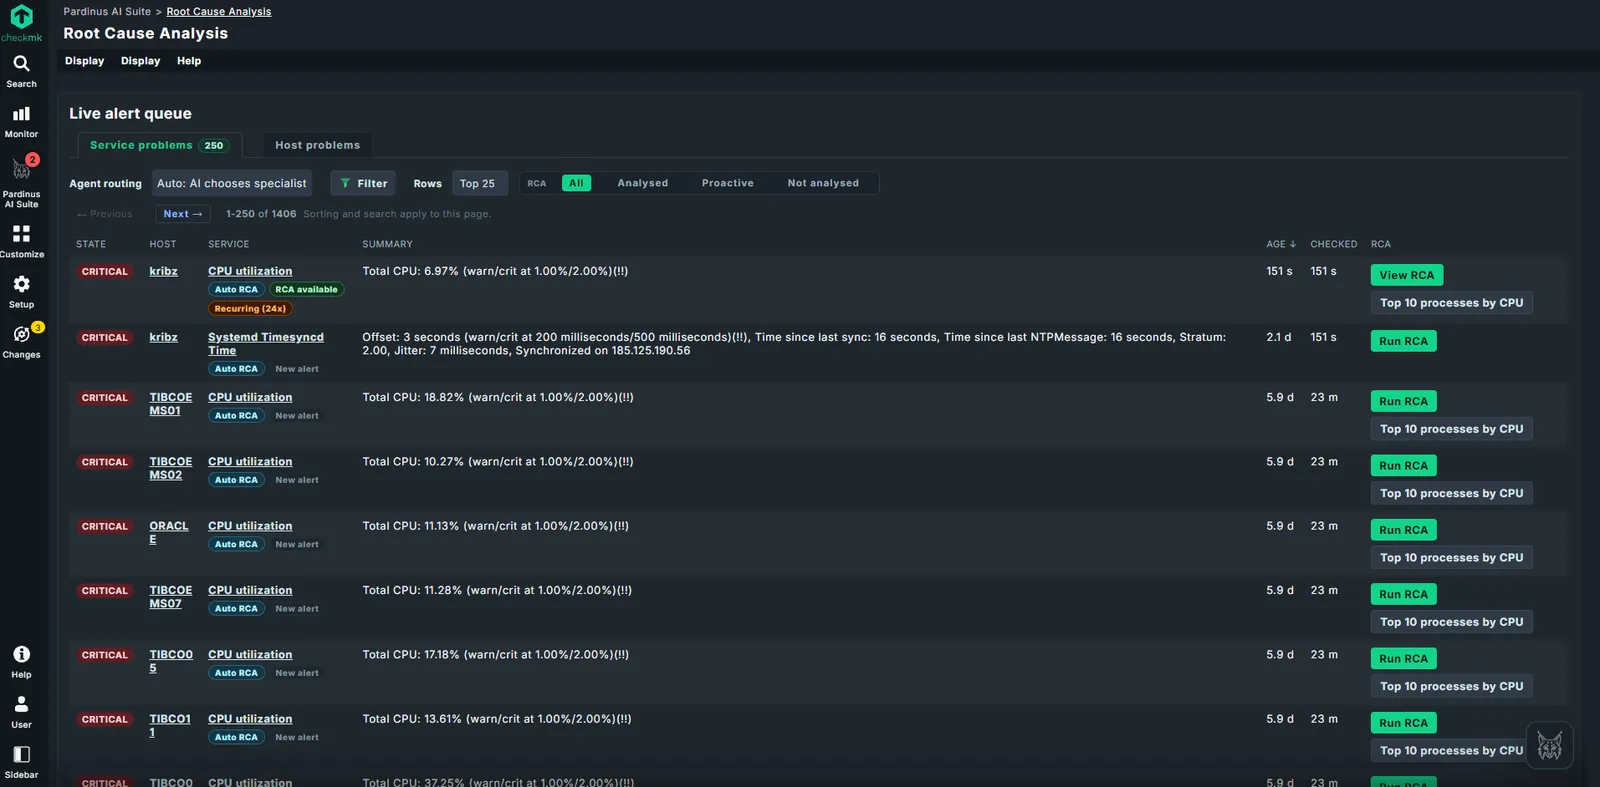
The live queue shows host and service problems with the state of their analysis: already analysed, picked up automatically, or still untouched. Routing is automatic across Linux, Windows, database and network, and you can override it per alert.
The queue tells you where you stand
Recurring alerts are marked as recurring, with the count. An alert that already has an answer offers the answer instead of another analysis.
- Auto RCA, on demand RCA, or none, visible per row
- Repeated unchanged alerts reuse the previous result
- Filter by site, host, folder or service pattern
A verdict you can argue with
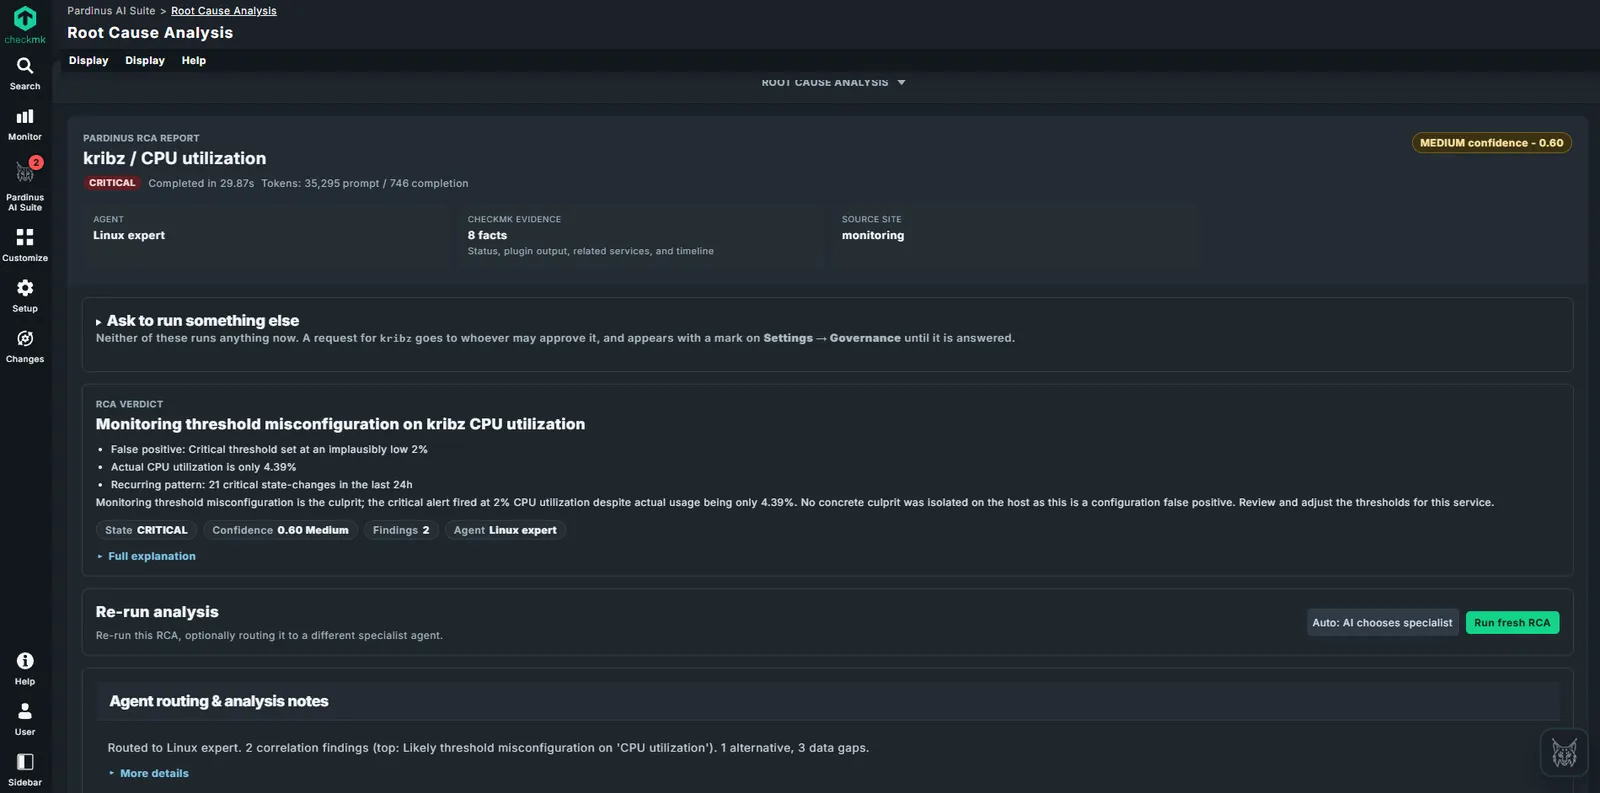
The report names the likely cause, scores its own confidence, and lists the Checkmk facts it used. Where the evidence is thin, it says so rather than filling the gap.
- Confidence score with alternatives and data gaps
- The evidence package behind the answer, in full
- The performance graph for the service, in the report
- Run again against a different specialist agent
In this run it found no incident at all: the critical threshold was set at 2%, actual usage was 4.39%, and the alert had flapped 21 times in a day.
Answer first, spend later
Not every alert deserves a model
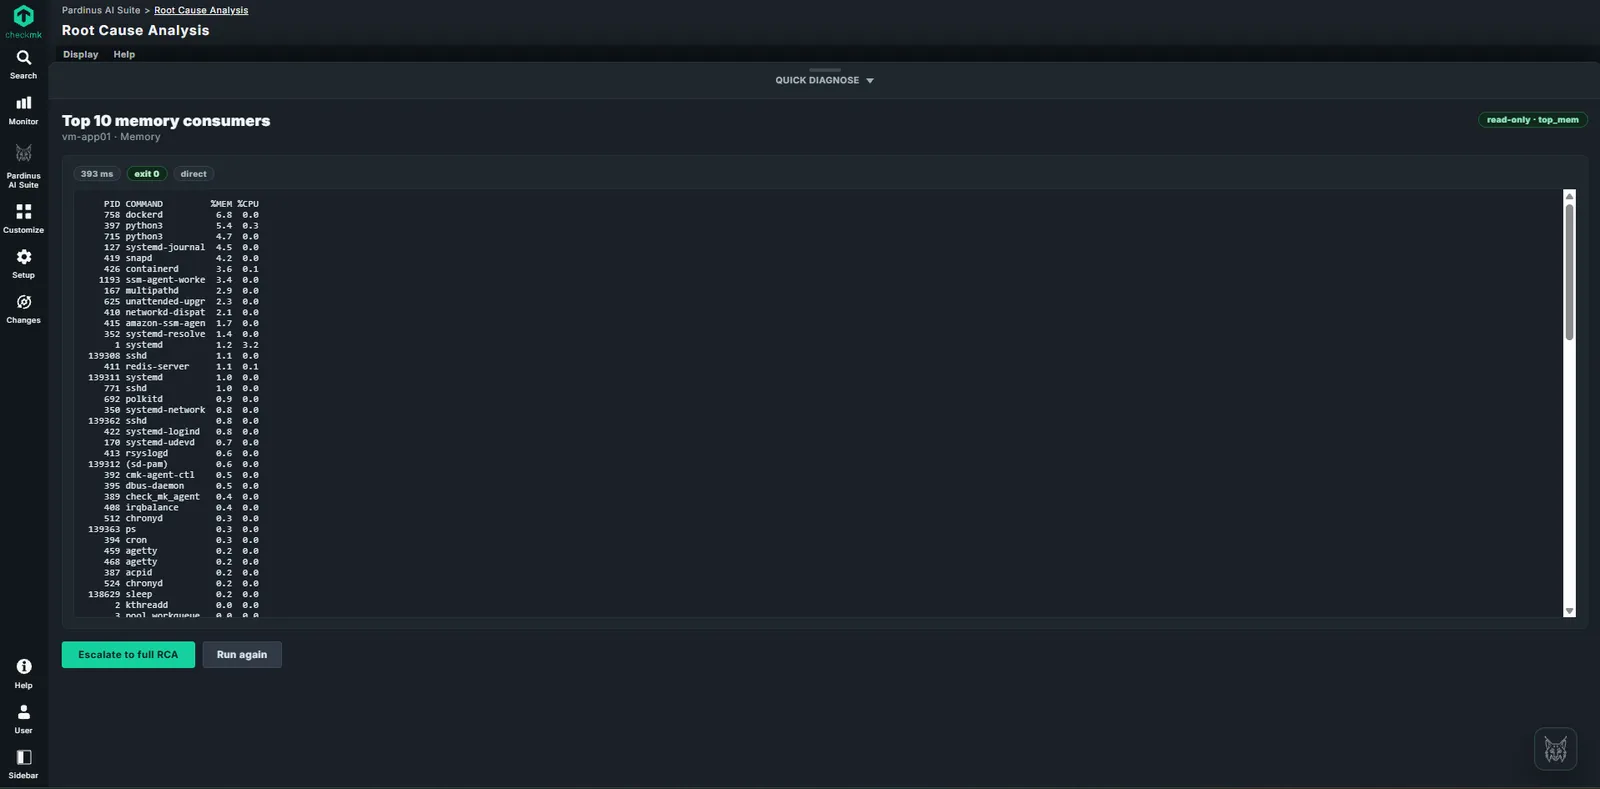
Most on call questions are answered by one command. Quick Diagnose runs it as a read only, deterministic check in about a second and offers to escalate only if what you see isn't enough.
Quick Diagnose
A named playbook attached to the alert type: top processes by CPU, top memory consumers, filesystem growth. Raw output, exit code, timing.
- Read only by definition, nothing changes on the host
- No tokens consumed
- One button to escalate into a full analysis
Action Path: the Run button is the approval
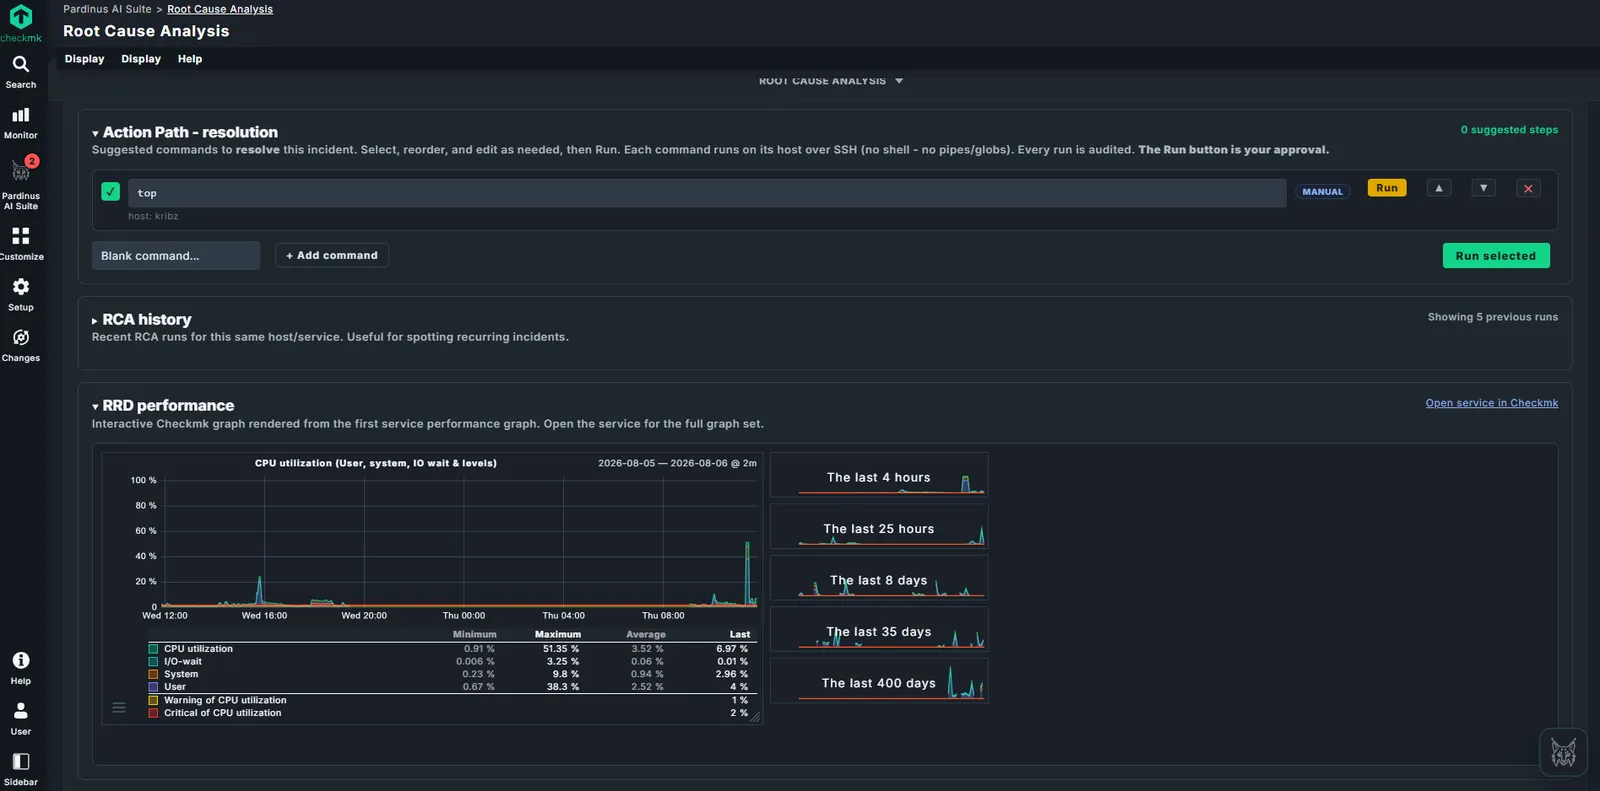
When an analysis suggests a fix, the steps arrive as an editable list. You select, reorder, edit, and run. Commands execute over SSH with no shell, no pipes, no globs, and anything outside the allowlist has to be requested and granted first.
- Per host concurrency limits and loop detection
- Credentials from the Checkmk password store
- Every execution written to the audit log
Native
Configured in Checkmk, not beside it
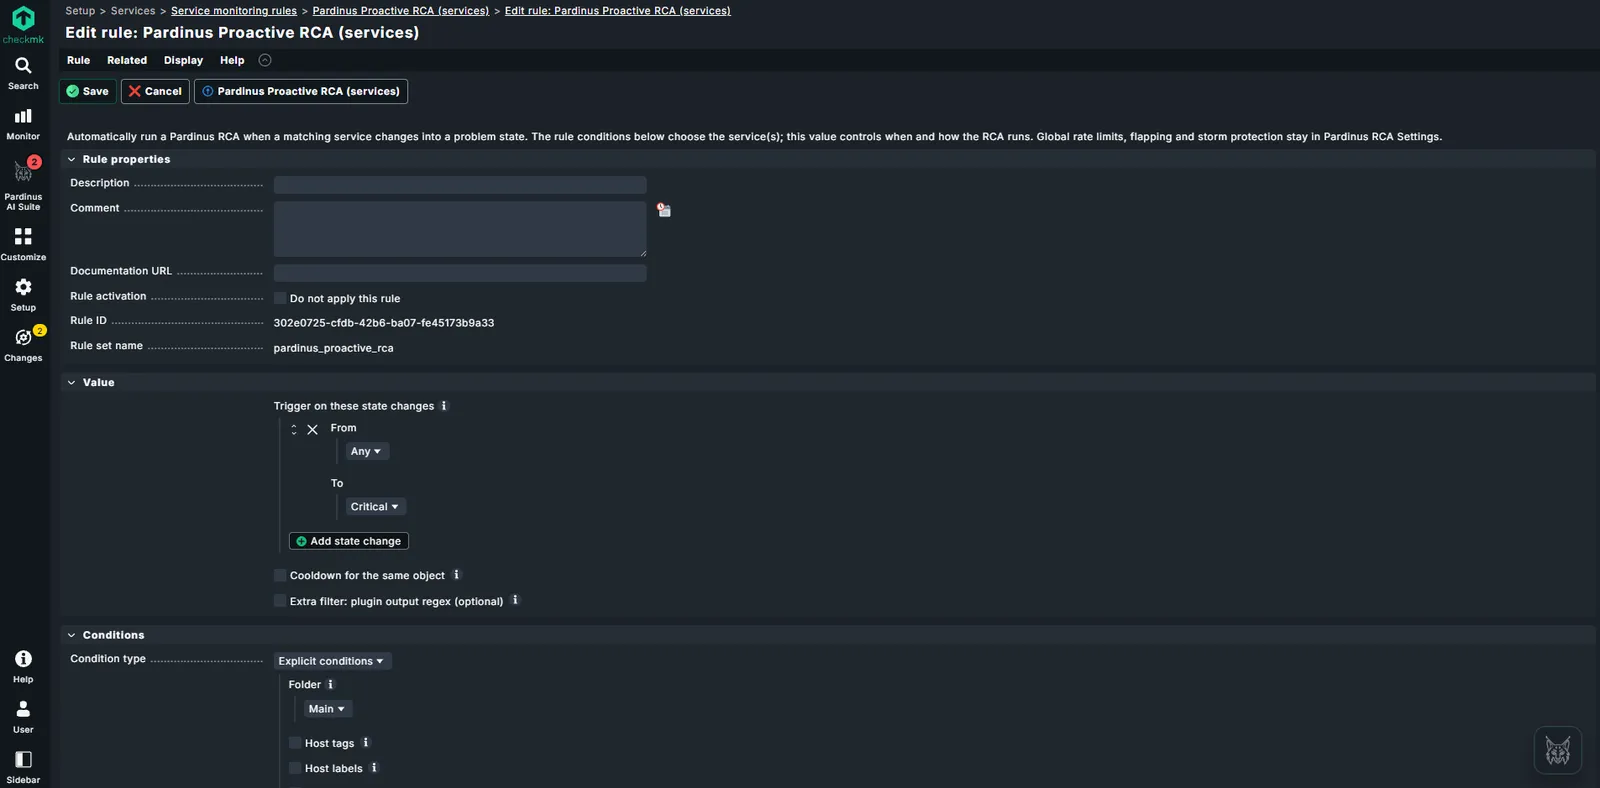
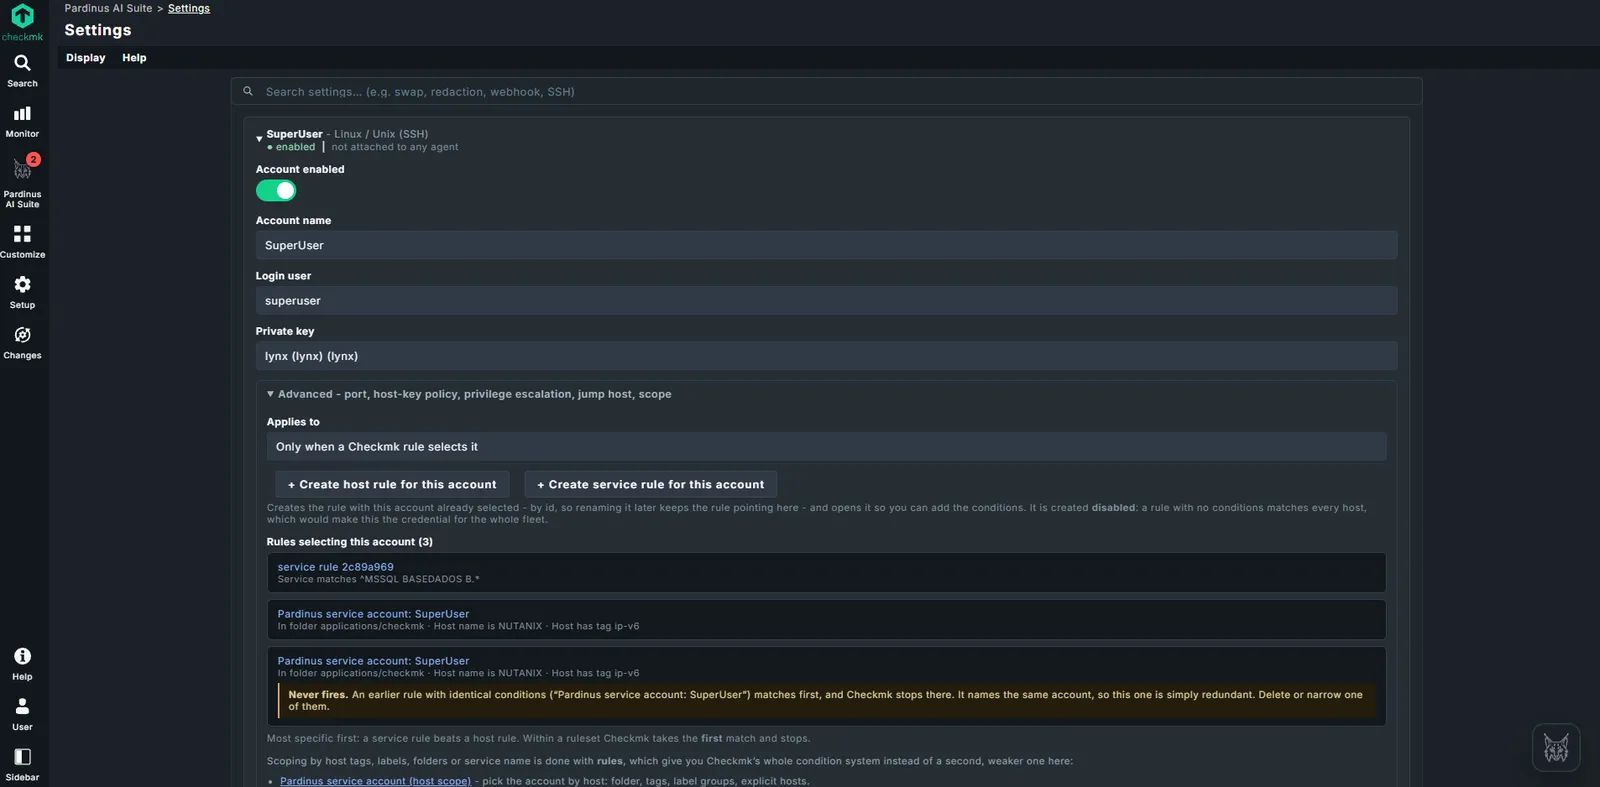
Scoping happens where your team already scopes everything else. Proactive analysis and the SSH accounts it uses are ordinary rulesets, with folders, host tags, labels and explicit hosts, and the usual first match wins behaviour.
Rulesets, not a parallel config
Choose which services start an analysis on their own, on which state change, with which cooldown. Choose which machines use which login. Nothing to learn that isn't already Checkmk.
- Proactive analysis scoped by service rule
- Service accounts scoped by host rule
- Shadowed rules detected and explained, not silently ignored
Learn
The second time should be cheaper than the first
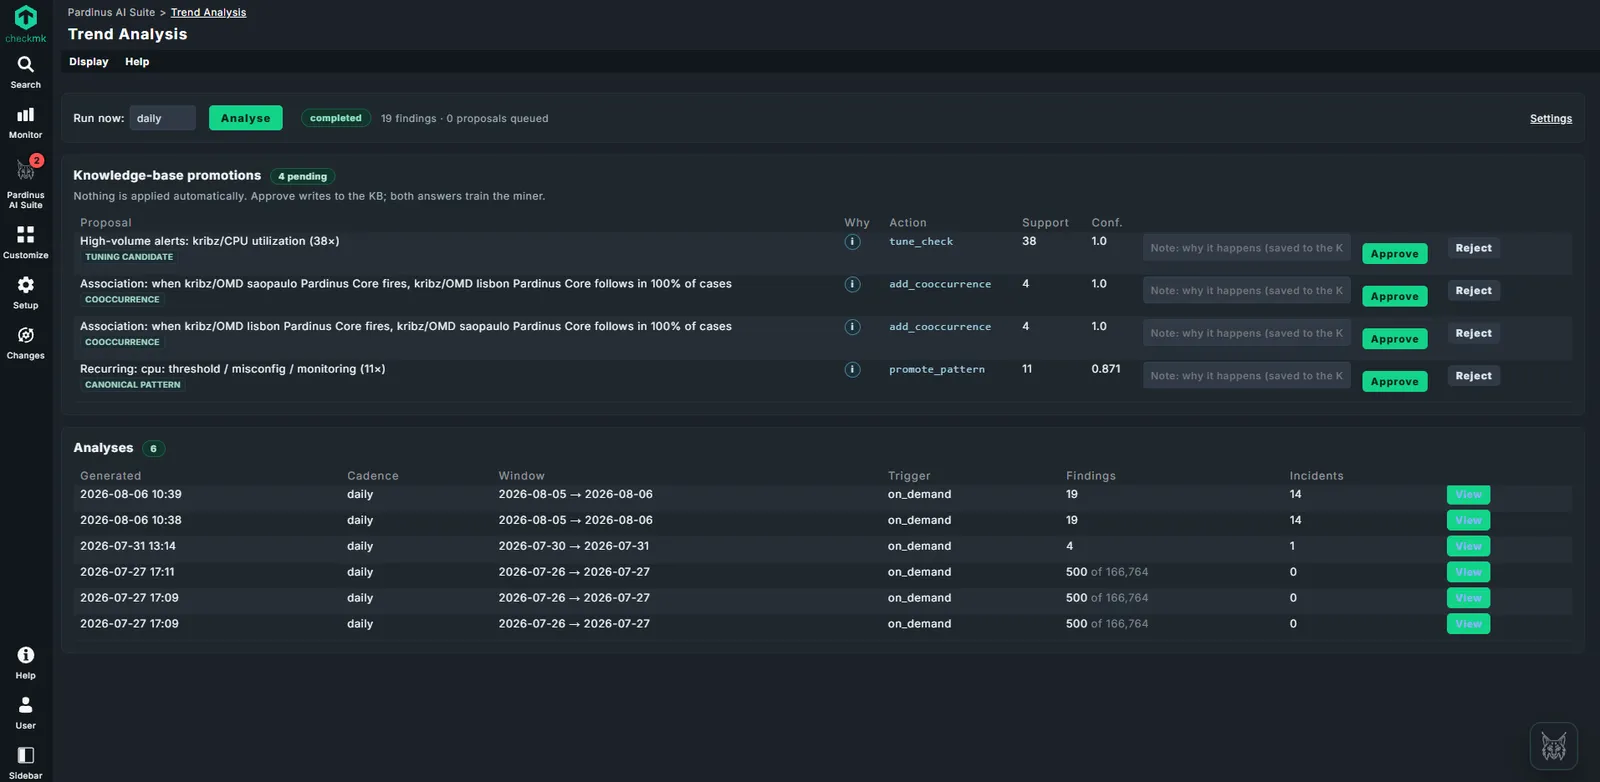
Statistics run on your incident history on a cadence: high volume alerts worth tuning, services that always fail together, patterns that keep coming back. The numbers are computed deterministically; the model only writes the explanation.
Nothing enters the knowledge base on its own
Proposals wait in a queue with their support count and confidence. You approve or reject, optionally adding the reason it happens. Both answers train the next analysis.
- Tuning candidates for alerts that fire too often
- Services that occur together across sites
- Recurring canonical patterns with support and confidence
And the configuration itself gets reviewed
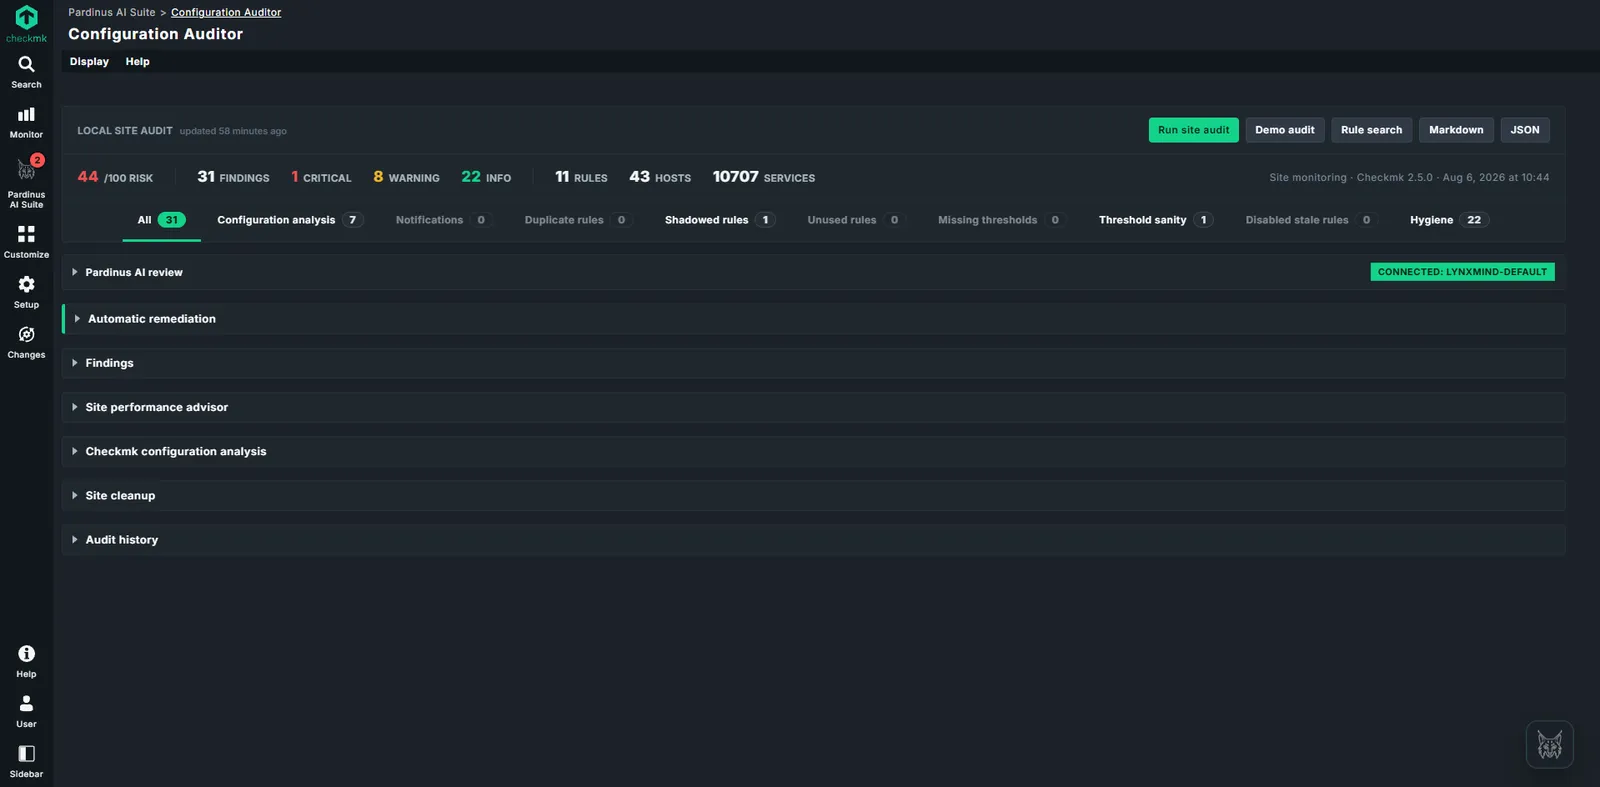
The Configuration Auditor scores the site and lists what is wrong with it: duplicate rules, shadowed rules, rules that never match, thresholds that are missing or implausible. Export as Markdown or JSON.
- Risk score with critical, warning and informational findings
- Site performance advisor and cleanup suggestions
- Audit history, so you can show the trend
Ask
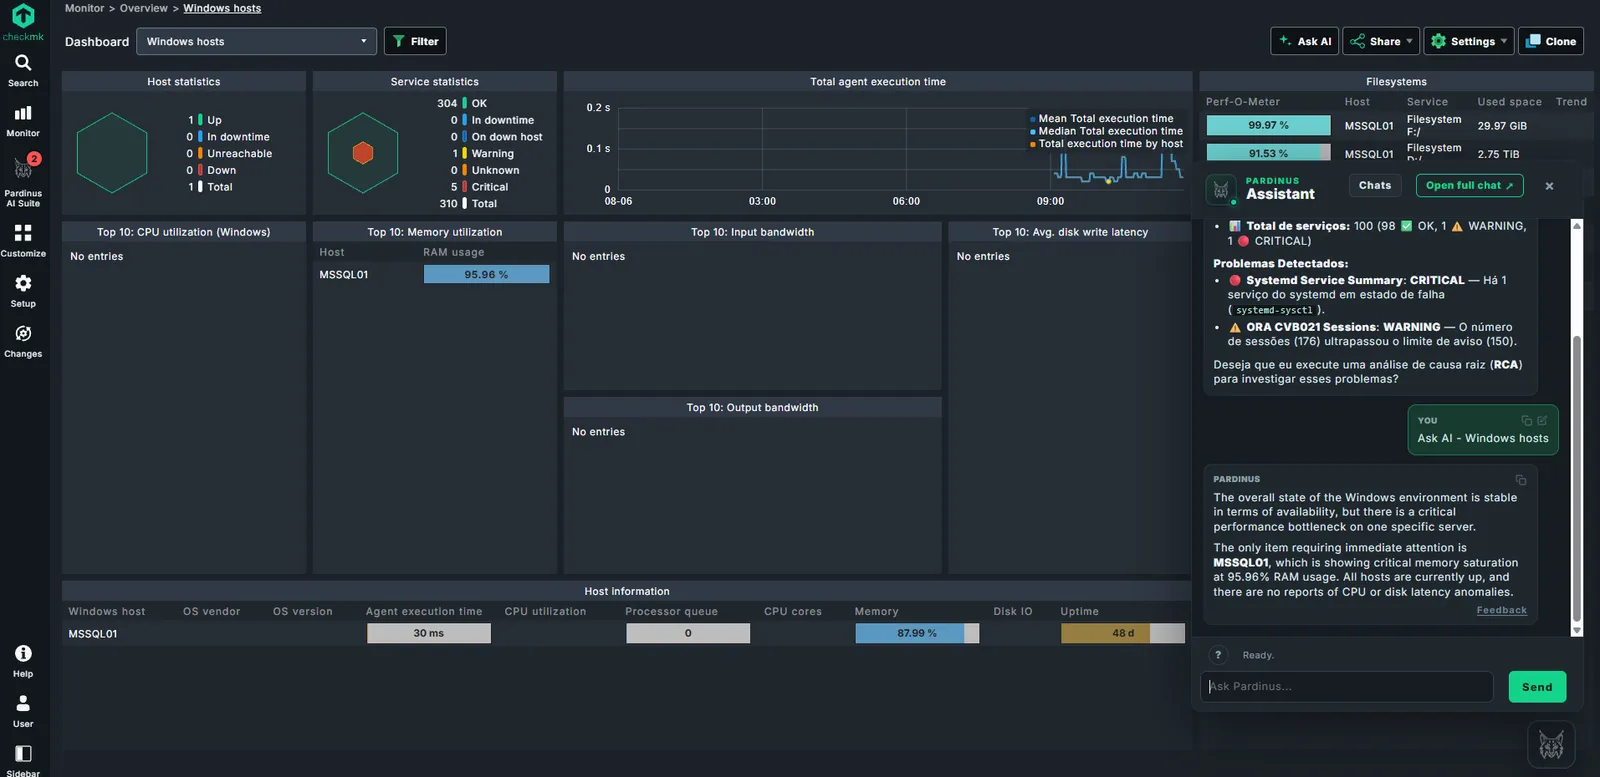
Talk to your estate, from any dashboard
Context-aware answers
The assistant sits beside the view you are already looking at. Ask about a host, a service, a dashboard you don't recognise, or a Checkmk concept, and get an answer about your systems, not a documentation quote.
- Side panel on any dashboard, or a full page with history
- Answers in the language you ask in
- Offers to open a full analysis when it finds something
- Voice input and spoken replies
Control
Answerable to somebody
An AI near production monitoring needs a shorter leash than a dashboard does. Permissions, spend and behaviour are configuration, not promises, and when an agent wants to do something it isn't allowed to do, it asks and waits.
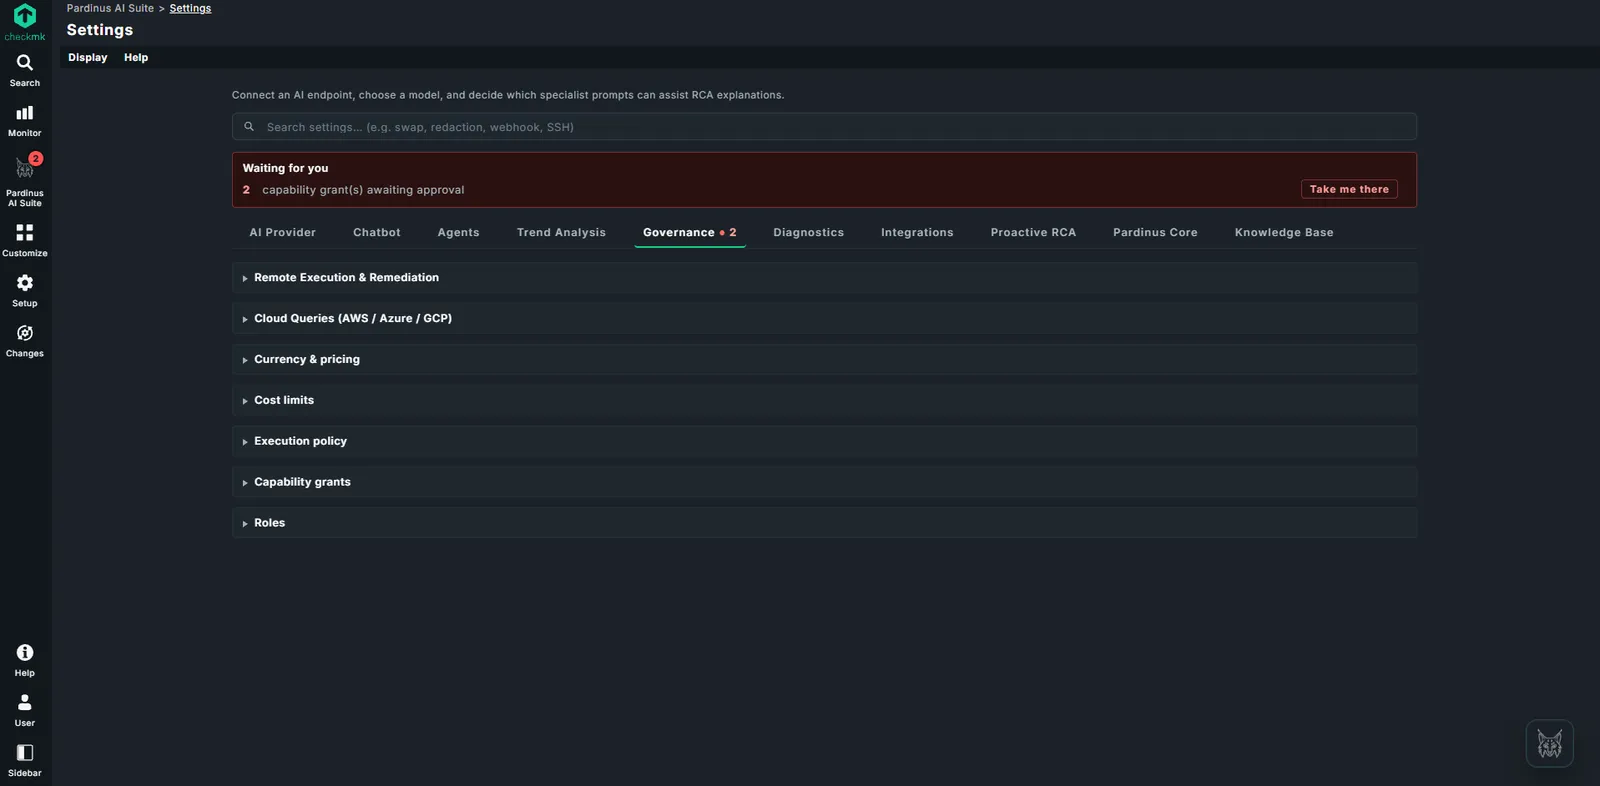
Governance is a tab, not a footnote
- Capability grants queued for human approval
- Execution policy and command allowlists
- Cost limits per site and per period
- Per role permissions inside Checkmk
- Redaction of sensitive values before anything leaves
What it costs, and whether it is healthy
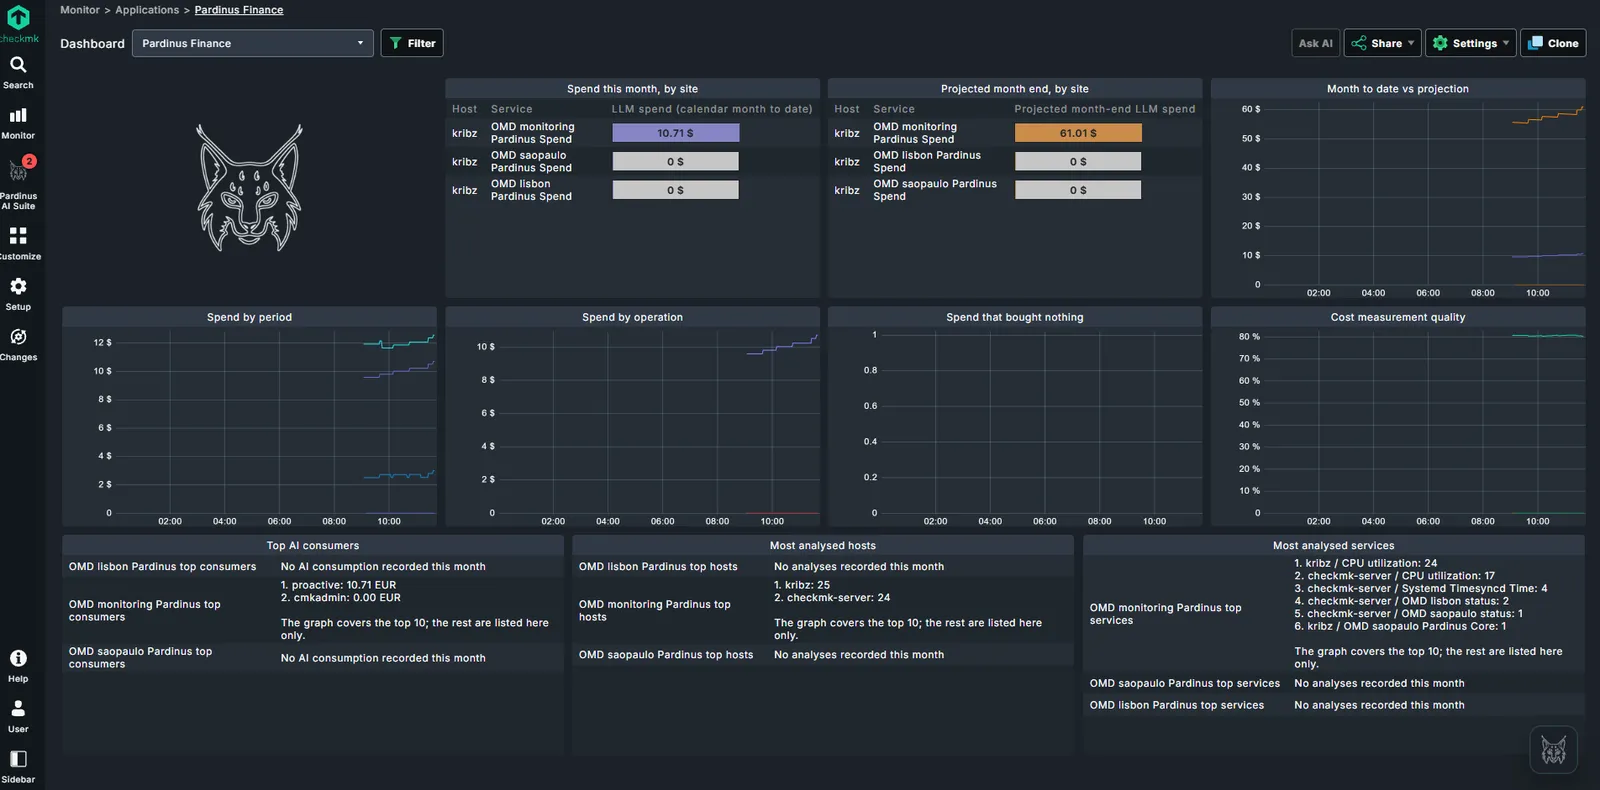
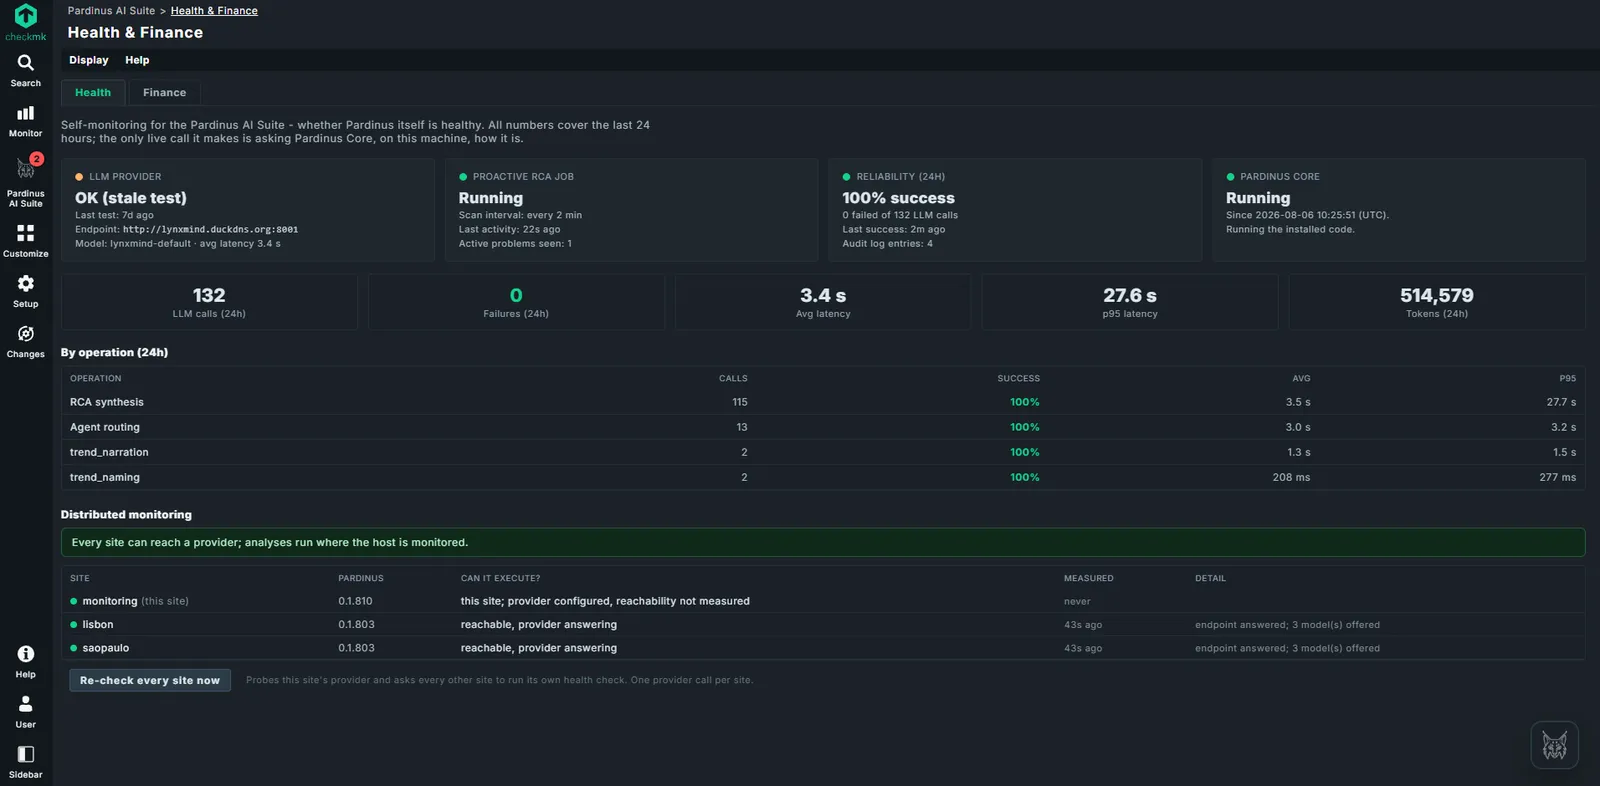
Token spend is tracked per site, per operation and per user, with a month end projection and a plain answer to the awkward question: how much of this spend bought nothing, because the alert had already been analysed.
- Spend month to date against projection, by site
- Tokens saved by reusing results for repeated alerts
- Provider reachability, success rate and latency percentiles
- For distributed setups: whether every site can reach a provider
Deterministic before AI
Context is built from Livestatus and the REST API first. The model interprets a package it did not assemble.
Deterministic fallback
If generation fails, the evidence package is still returned, so the shift keeps moving.
Bring your own model
Any OpenAI compatible endpoint: self hosted, corporate, Azure OpenAI, or a public provider. Your data boundary.
Runs where the host is monitored
In distributed setups the analysis executes on the site that owns the host, not through a central bottleneck.
API first
Wire it into what you already run
Built for incident pipelines
Every capability is exposed through a versioned REST API. Trigger an analysis from your incident pipeline, pull the report into the ticket, attach the evidence to the channel where the shift actually talks.
/api/v1/rca/run Start an analysis
/api/v1/rca/{job_id} Poll status
/api/v1/rca/{job_id}/report.json Fetch the report
/api/v1/chat/query Ask a question
Bearer auth. Callback or polling. Roughly fifteen minutes to attach an analysis to every new incident.
Pilot
See it against your own alerts
A guided pilot on your Checkmk, your model endpoint, your noisiest services. If it doesn't reduce the time your team spends deciding what to look at first, it isn't worth installing.