Every monitoring team knows the feeling: a storm of alerts hits the dashboard at 3 AM, and the real work begins - not just acknowledging alarms, but figuring out why they’re firing, what’s actually broken, and what to do about it. That triage process is slow, manual, and depends heavily on whoever happens to be on call. Pardinus AI Suite was built to change that.
Pardinus is an AI Suite that integrates natively into Checkmk, turning raw alerts into structured, actionable root cause analysis - automatically. Instead of operators spending 20 to 40 minutes manually correlating logs, metrics, and timelines, Pardinus delivers a full RCA report in under a minute: a clear verdict, confidence score, alternative hypotheses, recommended next actions, and even suggested threshold corrections - all without leaving the Checkmk interface.
But Pardinus goes well beyond automated analysis. It’s a complete operational AI layer for Checkmk:
For operations teams, it means faster incident resolution, fewer escalations, and consistent diagnostics regardless of who’s on shift. A junior engineer at 3 AM gets the same quality of analysis that a senior specialist would produce during business hours. The built-in Chatbot acts as a constant companion - available as a floating assistant anywhere in Checkmk - where operators can query host health in natural language, get step-by-step Checkmk guidance, or even execute configuration actions like creating hosts or setting downtimes, all through conversation.
For team leads and managers, it brings structure and visibility. Every RCA is tracked with full history, so recurring problems are spotted immediately. The AI Consumption dashboard provides complete cost transparency - token usage, estimated costs, per-user breakdowns, and intelligent savings through RCA reuse — so there are no billing surprises and resource allocation is always informed.
For security and compliance, Pardinus is designed with enterprise-grade controls from the ground up. Sensitive data is redacted before reaching the AI provider, with a preview tool so administrators can verify exactly what leaves the environment. The Checkmk Password Store integration keeps API credentials secure. Granular chatbot guardrails let administrators define exactly which actions the AI can perform - from read-only lookups to full configuration changes - with optional confirmation steps and complete audit logging.
For architects and platform teams, Pardinus is API-first. Every capability - RCA, chat, structured reports - is exposed through a versioned REST API, ready to be wired into existing tooling: PagerDuty, ServiceNow, Jira, Slack, MS Teams, n8n, webhooks, or any custom pipeline. It supports Checkmk’s multisite architecture, ships with seven specialist AI agents covering networking, Linux, Windows, databases, SAP, middleware, and cloud — and lets teams create custom agents for anything else. It’s provider-agnostic, so you choose where your data is processed.
Pardinus doesn’t replace the monitoring team - it gives every member of that team the analytical depth of a senior specialist, the institutional knowledge of the entire organization, and the speed of automation. It makes the good teams faster and the stretched teams resilient.
In the sections below, I’ll walk through each feature in detail with screenshots from a live environment.
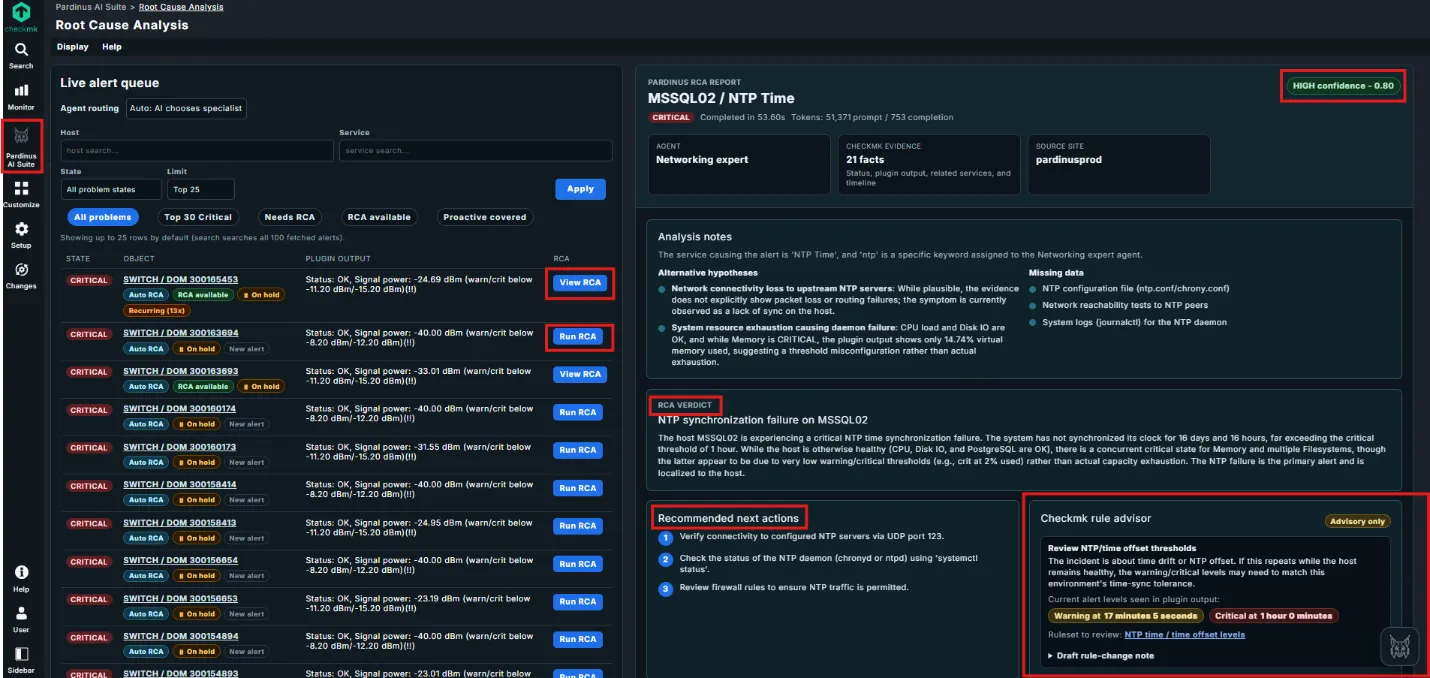
Live Alert Queue with Intelligent Routing The left panel presents a live alert queue that continuously surfaces critical problems across your Checkmk infrastructure. Alerts are displayed with their state, object, plugin output, and RCA status - all in one view. Each alert can be actioned directly with “Run RCA” or “View RCA” buttons, making triage fast and seamless.
AI-Powered RCA Reports with Confidence Scoring Each analysis generates a detailed RCA Report, clearly identified by host and service (e.g., MSSQL02 / NTP Time). Reports include a confidence score (e.g., “HIGH confidence – 0.80”), giving operators immediate visibility into how reliable the diagnosis is. You also get full transparency on token usage and completion time.
Structured Analysis with Alternative Hypotheses & Missing Data The Analysis Notes section doesn’t just give you one answer - it presents alternative hypotheses ranked by plausibility, along with a clear list of missing data that could further refine the diagnosis. This helps teams understand not just what went wrong, but what else to investigate.
RCA Verdict – Clear, Actionable Summary The RCA Verdict delivers a plain-language explanation of the root cause. In this example, Pardinus identifies an NTP synchronization failure, explains that the clock has drifted beyond the critical threshold, and contextualizes the alert against other system metrics - noting that concurrent memory/filesystem alerts are likely due to low thresholds rather than real exhaustion.
Recommended Next Actions Every RCA includes a numbered list of recommended next actions, prioritized for the operator: verify NTP connectivity, check daemon status, review firewall rules. No guesswork - just a clear remediation path.
Checkmk Rule Advisor The Rule Advisor goes a step further: it analyzes the alert thresholds currently in place and suggests rule changes when they appear misconfigured. In this case, it flags that the warning/critical levels for NTP time offset may need adjustment, shows the current alert levels, and links directly to the relevant Checkmk ruleset for review. Operators can even draft a rule-change note on the spot.
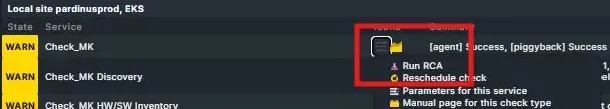
Run RCA – One-Click Action Directly from Checkmk Service Views Pardinus integrates seamlessly into Checkmk’s native service context menus. Every service in a non-OK state (WARN, CRIT, UNKNOWN) gets a “Run RCA” action added directly to its action menu — right alongside standard Checkmk options like Reschedule check, Parameters, and Manual page.
With a single click, operators are redirected to the Pardinus RCA page with the host and service already in context, and the analysis is triggered immediately. There’s no need to navigate to the Pardinus AI Suite separately, search for the host, or copy-paste service names — the workflow goes straight from “I see a problem” to “I’m getting an answer” in one action.
This means Pardinus fits naturally into the way operators already work in Checkmk. Whether you’re scanning a host’s service list, reviewing a dashboard, or investigating an alert — the AI-powered root cause analysis is always just one click away, exactly where you’d expect it.
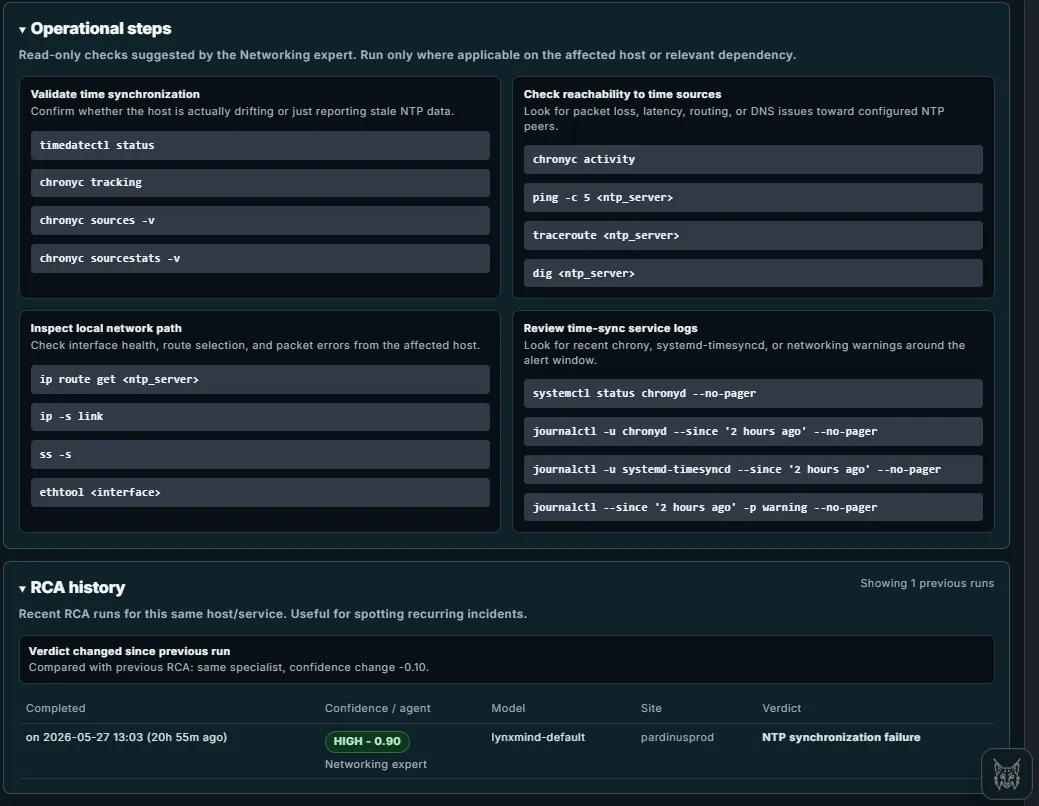
Operational Steps – Expert-Curated Diagnostic Commands Beyond the verdict and recommended actions, Pardinus provides a full set of operational steps — read-only diagnostic commands suggested by the AI specialist agent. These are organized into logical investigation categories.
RCA History – Track Recurring Incidents Over Time At the bottom of each report, the RCA History section shows previous analysis runs for the same host/service combination. This is invaluable for spotting recurring incidents and understanding how a problem evolves.
The history tracks the completion timestamp, confidence score, AI model used, source site, and verdict for each run. When the verdict changes between runs, Pardinus highlights this explicitly - for example, “Verdict changed since previous run – same specialist, confidence change -0.10” - giving teams a clear signal that the situation is evolving and may need escalated attention.
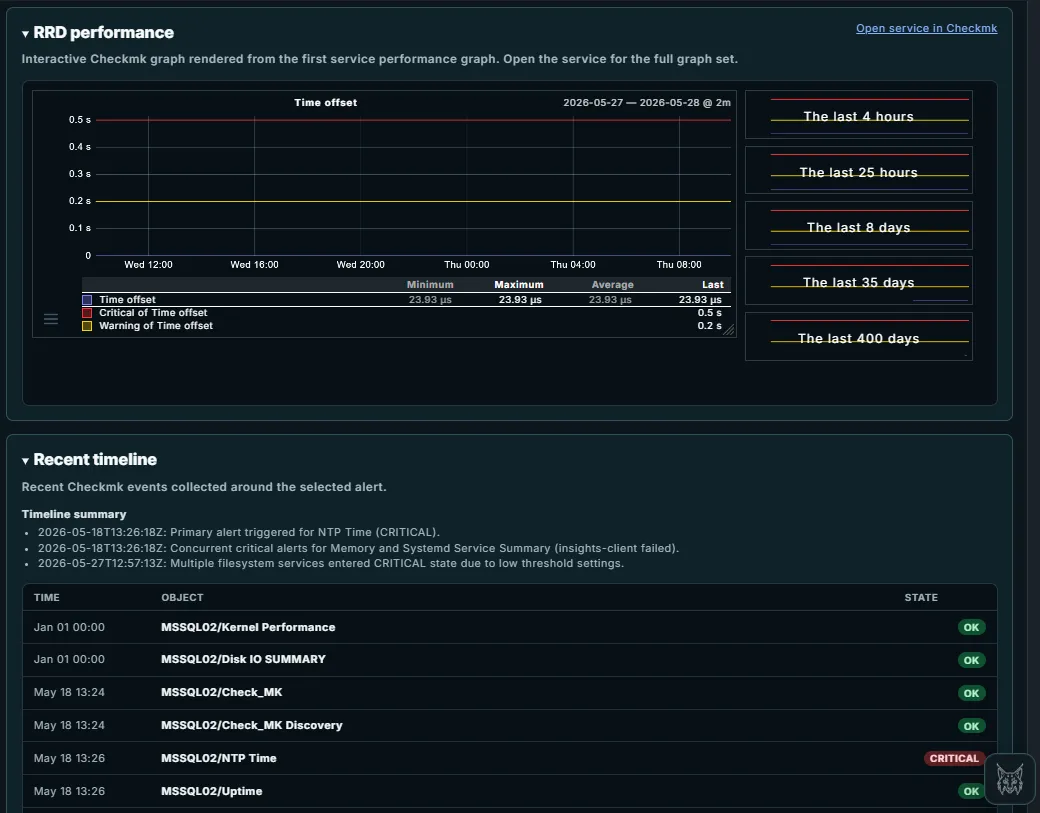
RRD Performance – Checkmk Graphs Embedded in the RCA Report Pardinus pulls the relevant RRD performance graph directly from Checkmk and renders it inside the RCA report - no need to switch tabs or navigate away. The interactive graph shows the service metric over configurable time ranges (from the last 4 hours up to 400 days), complete with minimum, maximum, average, and last values. Warning and critical thresholds are overlaid as colored lines, making it immediately obvious whether the metric is breaching its limits.
Recent Timeline – Correlated Events Around the Alert The Recent Timeline reconstructs the sequence of Checkmk events surrounding the selected alert, giving operators the full incident context at a glance. It starts with a Timeline Summary that highlights the key moments in plain language - when the primary alert fired, which concurrent alerts appeared, and what changed over time.
Below the summary, a detailed event table lists every state change for the affected host, with timestamps, object names, and state badges (OK, CRITICAL). This makes it easy to spot patterns: which services were healthy before the incident, what went critical at the same time, and whether other services on the same host are being affected. In this case, it’s clear that the NTP Time alert on MSSQL02 fired on May 18th while other core services (Kernel Performance, Disk IO, Uptime) remained OK - helping confirm that the issue is localized to time synchronization.
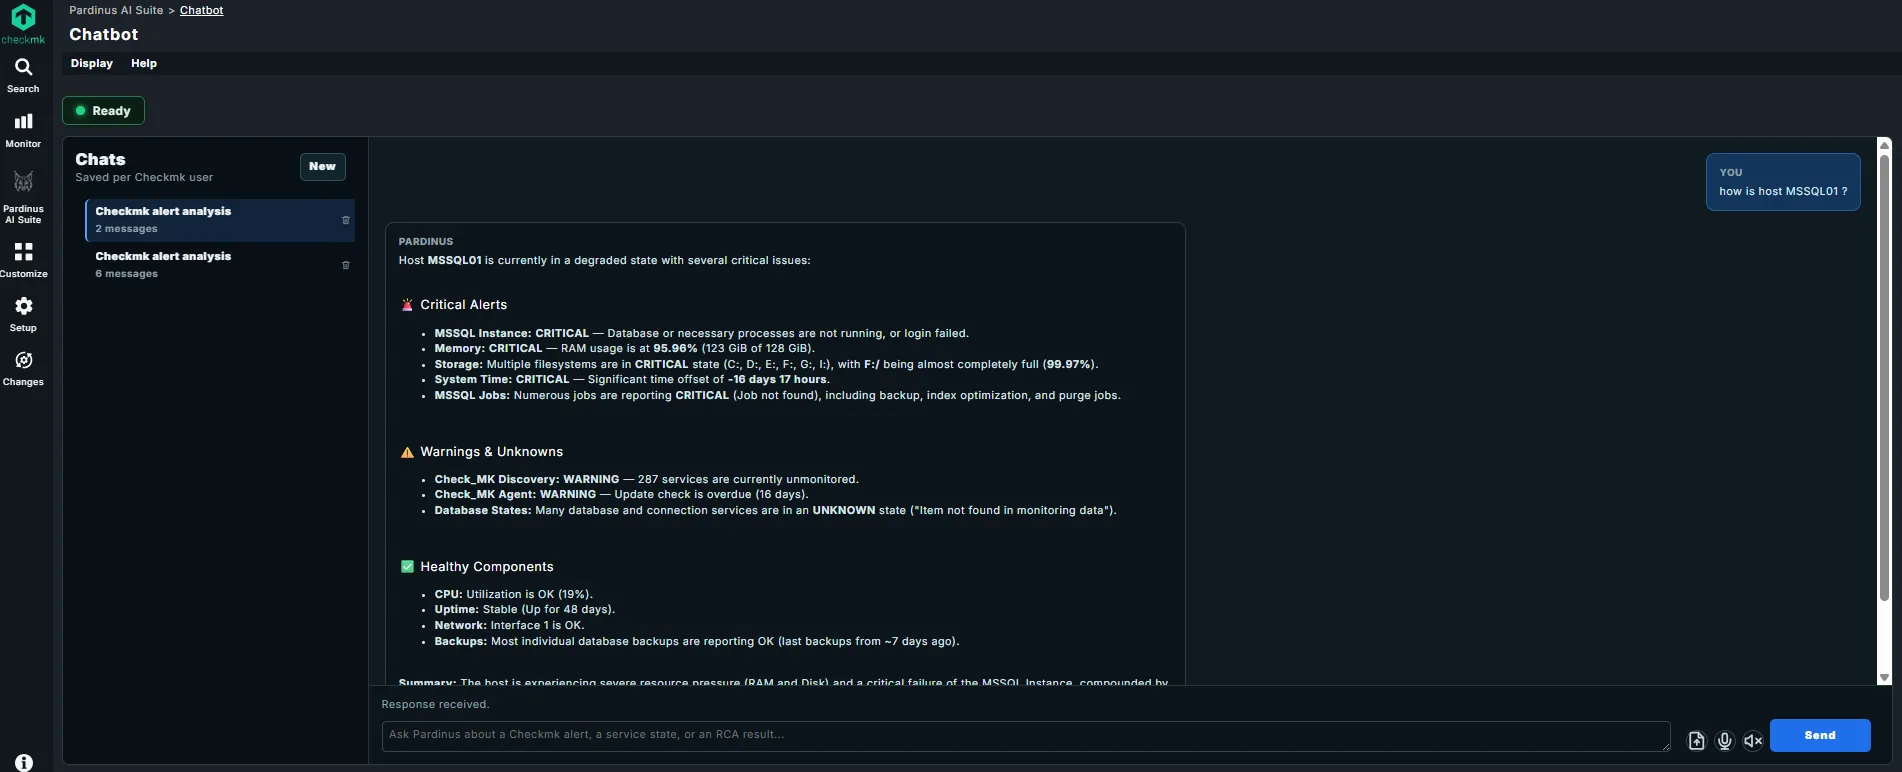
Pardinus Chatbot – Conversational Infrastructure Intelligence Pardinus includes a built-in Chatbot that lets operators query their Checkmk environment using natural language - right from the Pardinus AI Suite interface. Simply type a question like “how is host MSSQL01?” and get a comprehensive, structured health assessment in seconds.
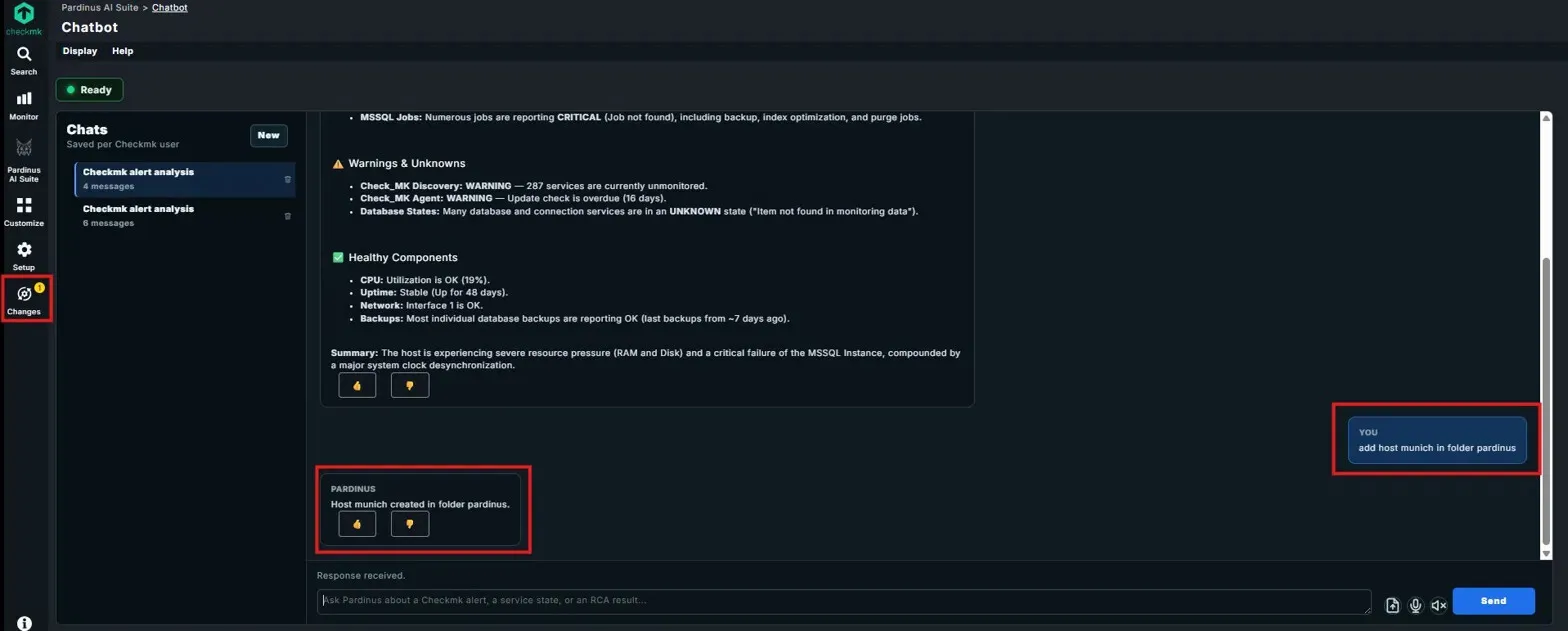
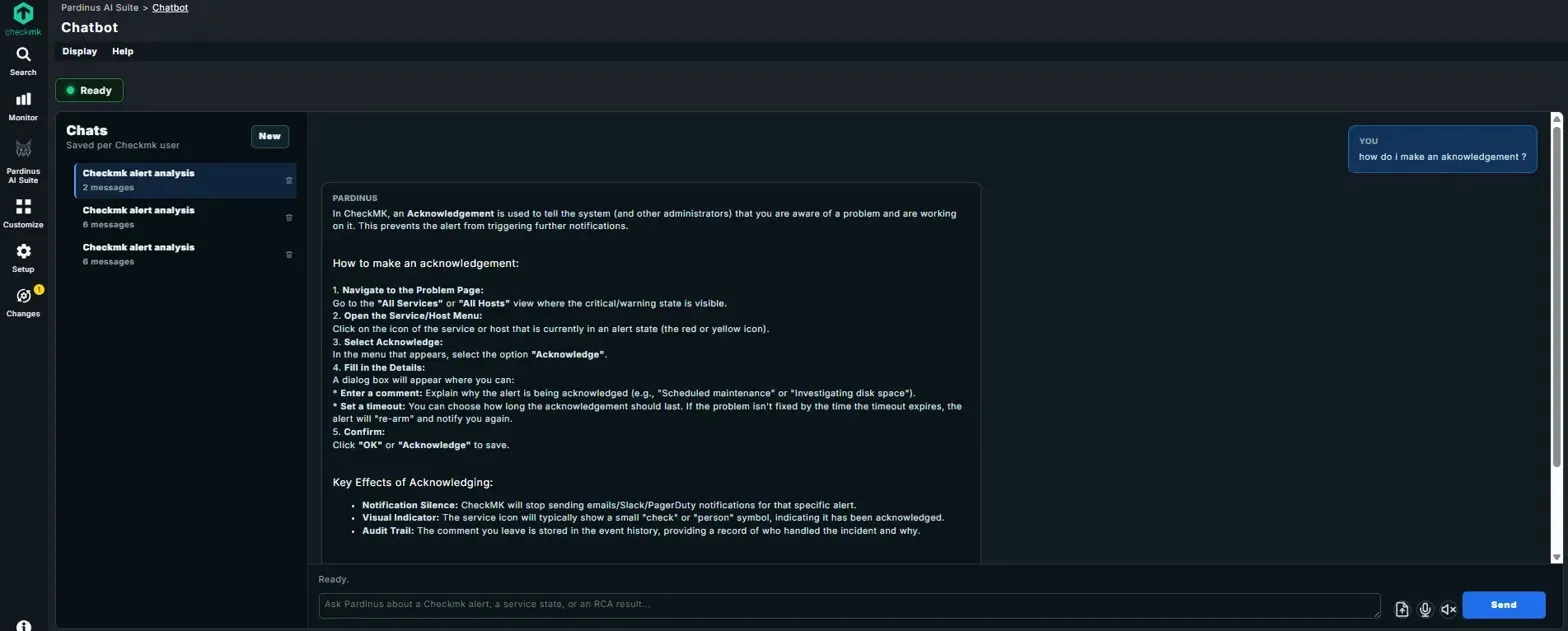
Chatbot Actions – Not Just Answers, Real Operations The Pardinus Chatbot goes beyond read-only queries - it can execute actions directly on your Checkmk environment through natural language commands. In this example, the operator simply types “add host munich in folder pardinus” and Pardinus creates the host immediately, confirming with a concise response: “Host munich created in folder pardinus.” Chatbot as Checkmk Knowledge Assistant Pardinus doesn’t just analyze alerts and execute actions - it also serves as an interactive Checkmk knowledge base. Operators can ask procedural questions like “how do I make an acknowledgement?” and receive detailed, step-by-step guidance directly in the chat.
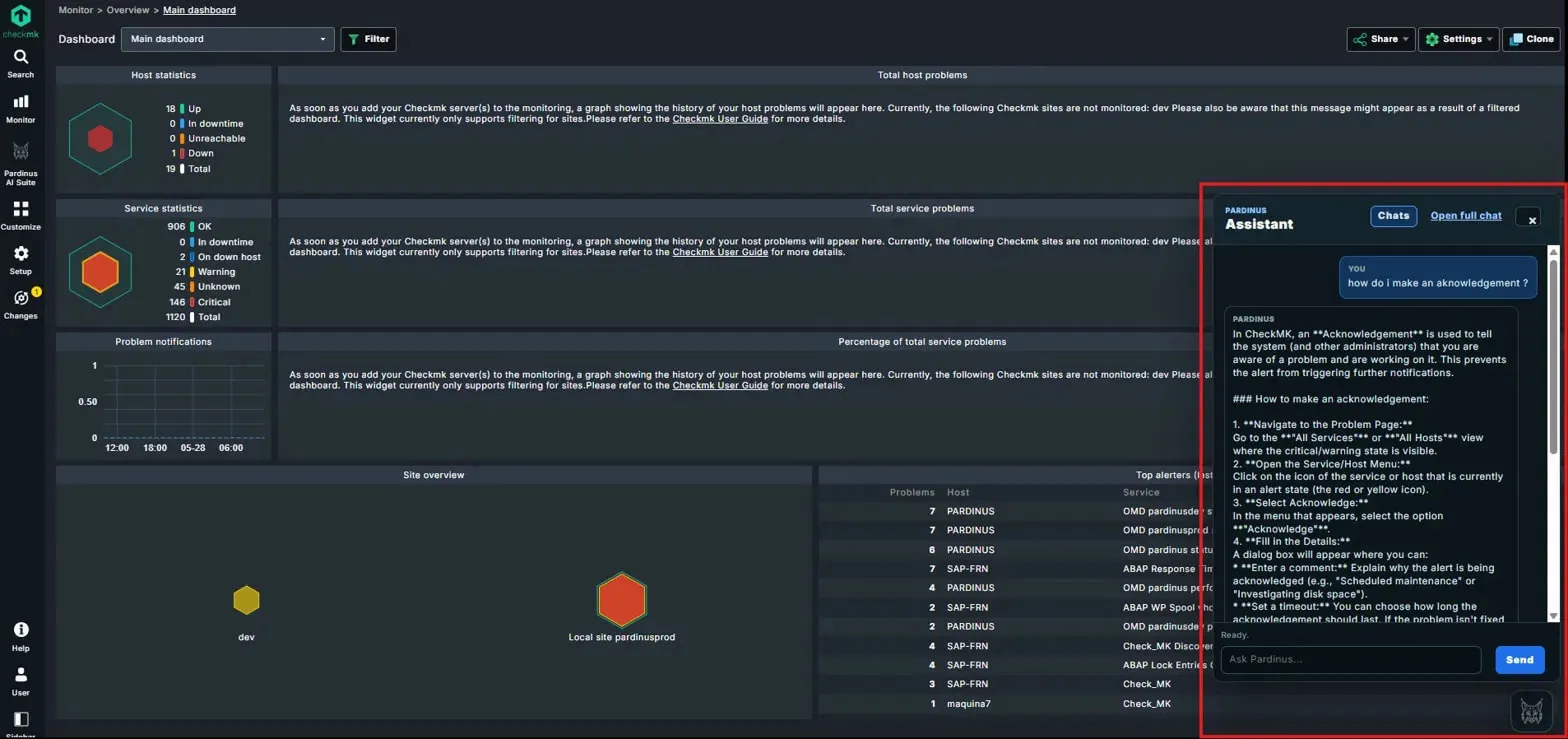
Pardinus Assistant – Embedded Sidebar in Checkmk Dashboards Pardinus isn’t confined to its own dedicated pages - the Pardinus Assistant is available as a sidebar panel directly within the native Checkmk dashboard. Operators can access it at any time without leaving their monitoring view, keeping full visibility of host statistics, service statistics, problem notifications, site overview, and top alerters while interacting with the AI.
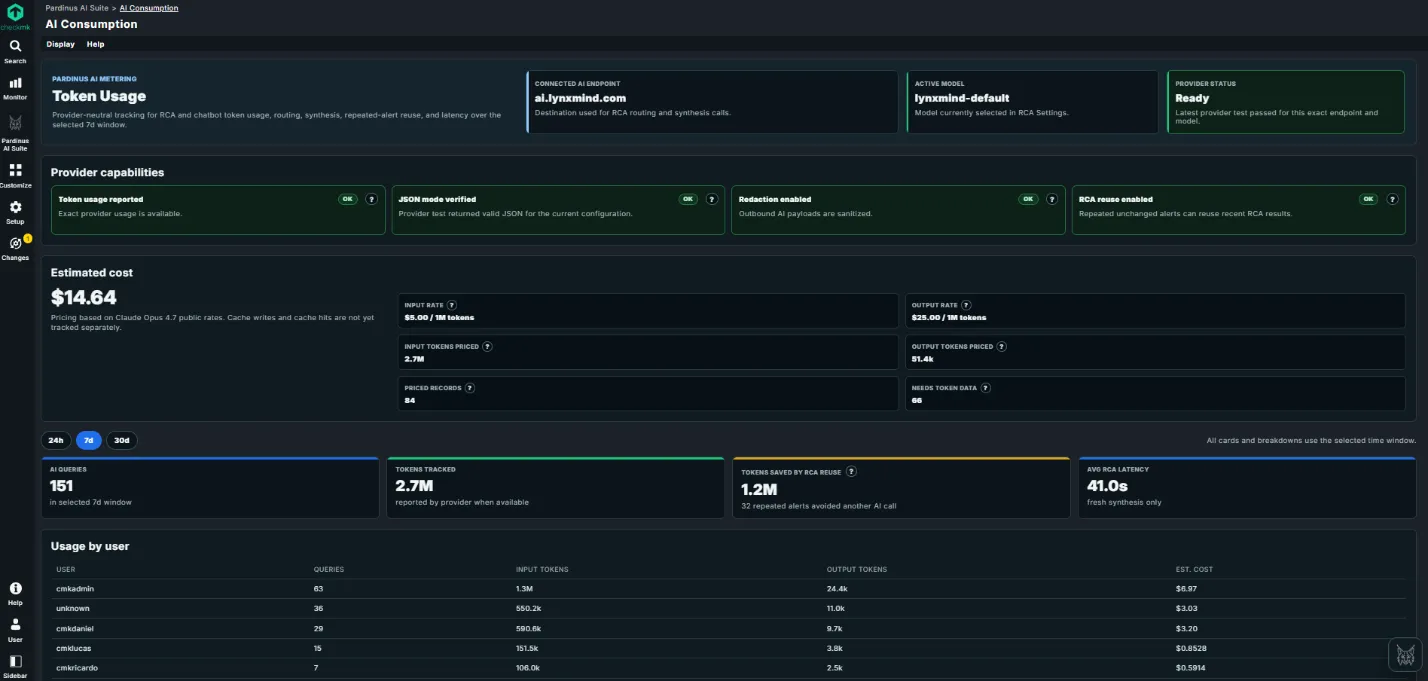
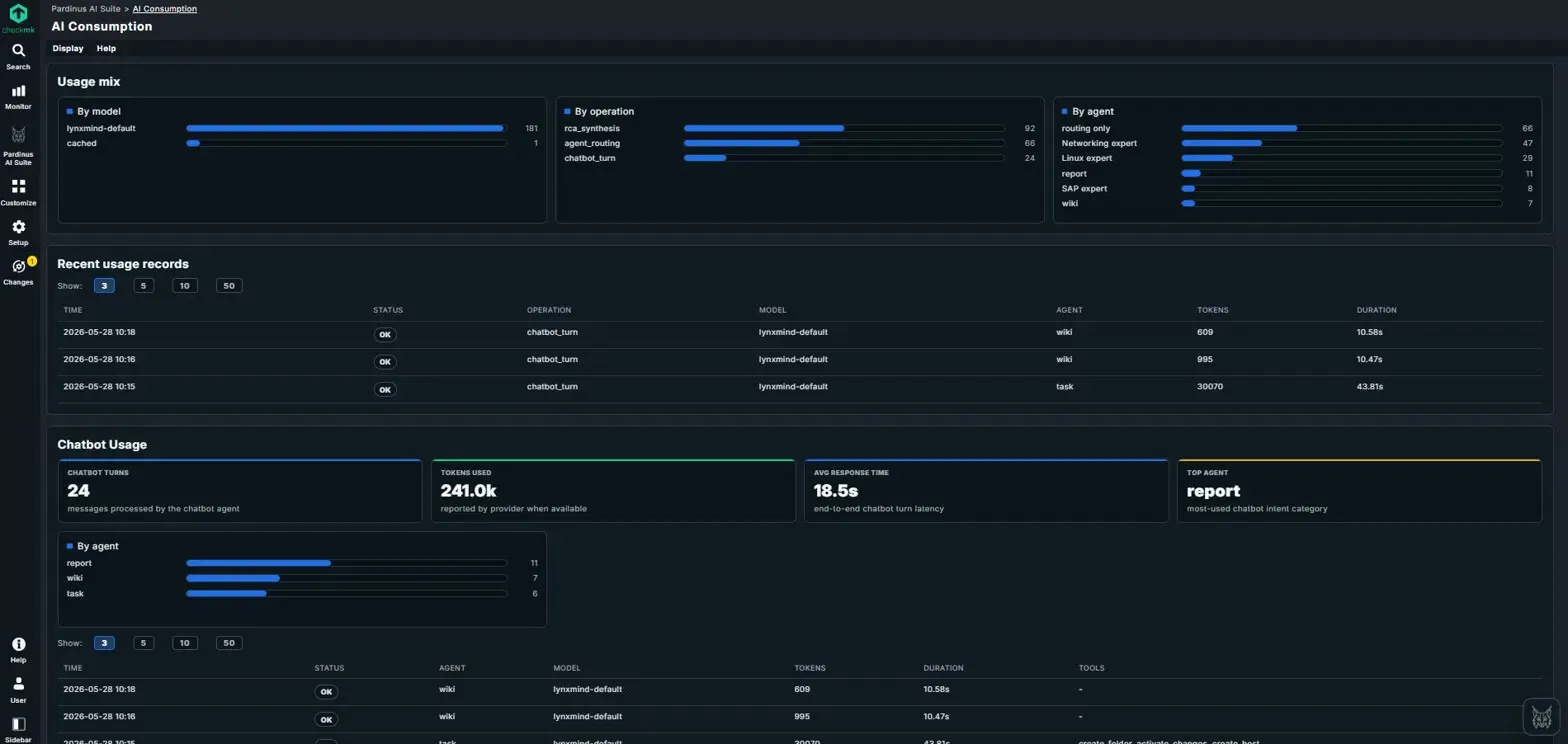
AI Consumption – Full Transparency on Usage and Costs Pardinus includes a dedicated AI Consumption dashboard that gives teams complete visibility into how AI resources are being used across the platform. No surprises on the bill - everything is tracked, broken down, and estimated in real time.
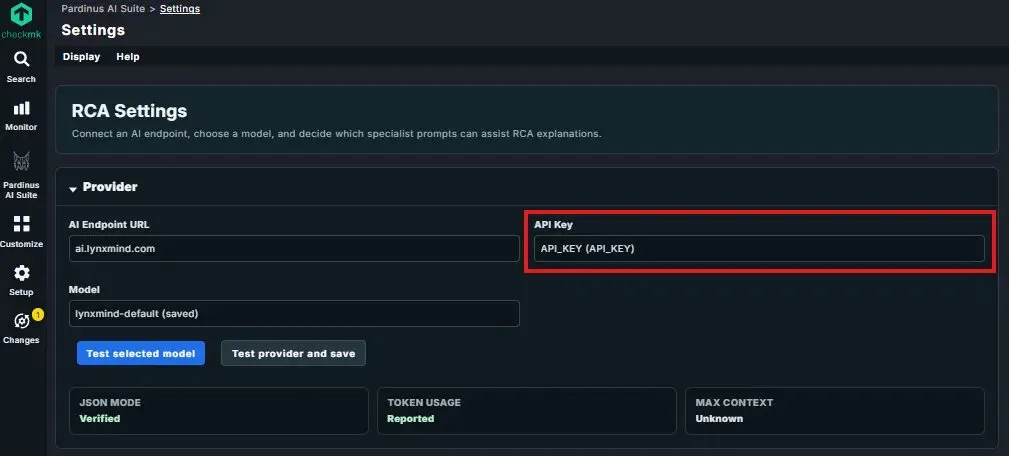
RCA Settings – Bring Your Own AI Provider Pardinus is designed to be provider-agnostic. In the Settings page, administrators configure the AI connection by specifying an AI Endpoint URL and selecting the Model to use. This means teams can point Pardinus to any compatible AI provider - whether it’s a cloud service, a self-hosted LLM, or an internal gateway — giving full control over where data is processed and which model powers the analysis.
Checkmk Password Store Integration The API Key field integrates directly with Checkmk’s native Password Store - highlighted here as a key security feature. Instead of pasting raw API keys into configuration fields, administrators can reference secrets already managed within Checkmk’s secure credential storage. This ensures that API keys are handled according to the same security policies and access controls that govern the rest of the Checkmk environment, with no plaintext credentials exposed in the Pardinus configuration.
Provider Validation Before going live, administrators can verify the connection with “Test selected model” and “Test provider and save” buttons. The status panel below confirms the provider’s capabilities: JSON Mode (Verified), Token Usage (Reported), and Max Context - ensuring the selected model meets Pardinus’s requirements before any RCA or chatbot queries are sent to it.
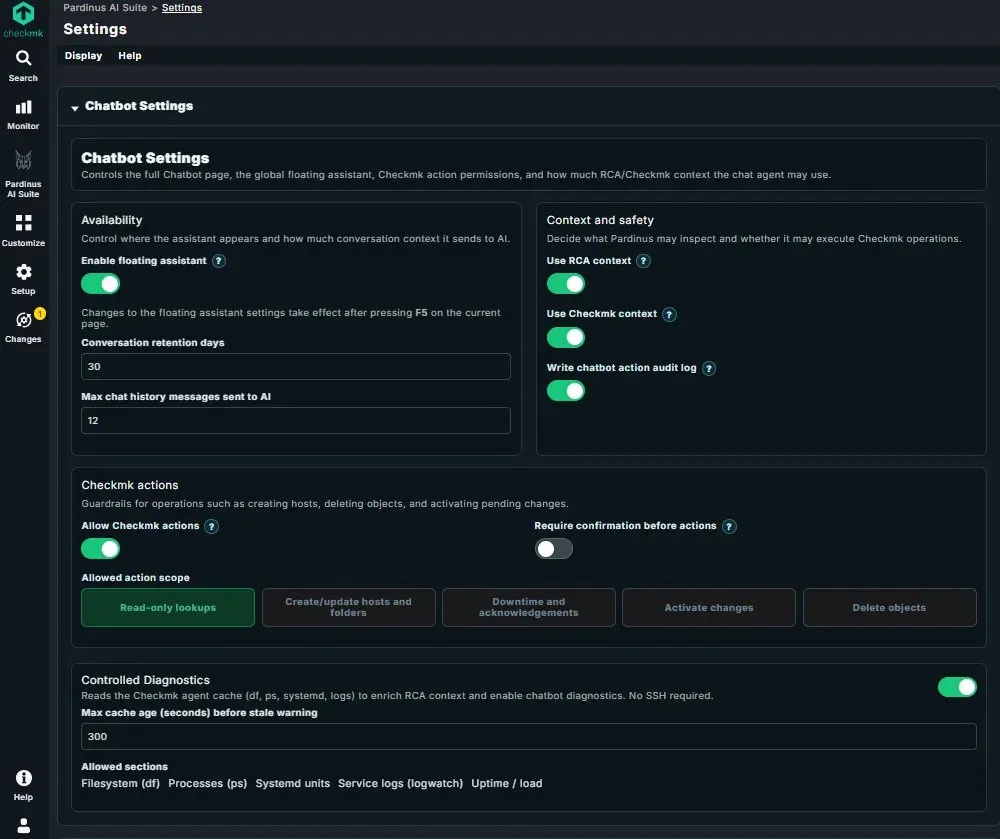
Chatbot Settings – Full Control Over the AI Assistant’s Behavior The Chatbot Settings page gives administrators granular control over every aspect of the Pardinus assistant - from where it appears, to what it can access, to what actions it’s allowed to perform.
Availability Administrators control the assistant’s presence and memory footprint: the floating assistant can be enabled or disabled globally, conversation retention is configurable (e.g., 30 days), and the max chat history messages sent to AI can be capped to control context size and token usage per interaction.
Context and Safety This section defines what knowledge the chatbot can draw on and how its operations are tracked. Toggles for Use RCA context and Use Checkmk context determine whether the assistant can reference previous RCA results and live Checkmk data when answering questions. The Write chatbot action audit log toggle ensures that every action the chatbot takes is recorded for compliance and traceability.
Checkmk Actions – Granular Guardrails This is where administrators define the boundaries of what the chatbot is allowed to do. The Allow Checkmk actions toggle is the master switch, and Require confirmation before actions adds a safety net by forcing user approval before any change is executed.
The Allowed action scope provides fine-grained permission levels, each selectable independently: Read-only lookups, Create/update hosts and folders, Downtime and acknowledgements, Activate changes, and Delete objects. This lets teams adopt Pardinus progressively - start with read-only, then enable write operations as confidence grows. An environment where only lookups and acknowledgements are permitted looks very different from one with full delete and activate permissions, and that choice is entirely in the administrator’s hands.
Controlled Diagnostics Pardinus can read the Checkmk agent cache (df, ps, systemd, logs) to enrich both RCA context and chatbot diagnostics - all without requiring SSH access to monitored hosts. Administrators configure a max cache age threshold to flag stale data, and can select exactly which sections are allowed: Filesystem (df), Processes (ps), Systemd units, Service logs (logwatch), and Uptime/load. This ensures the AI only sees the diagnostic data the team is comfortable sharing, with full control over the scope.
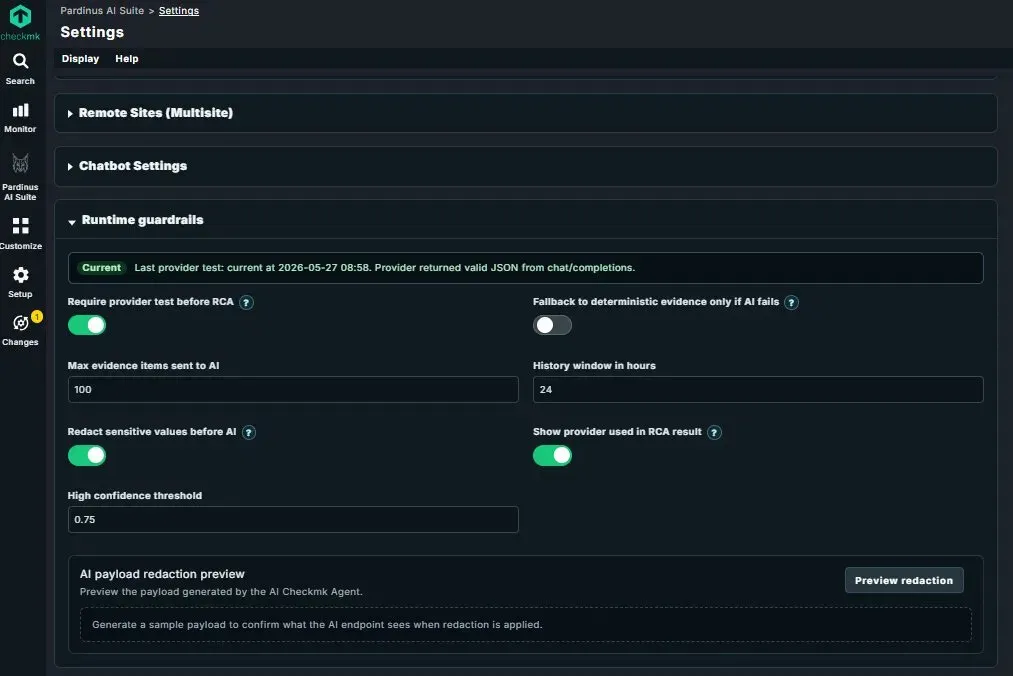
Runtime Guardrails – Safety, Privacy, and Quality Controls for AI Operations The Runtime Guardrails section gives administrators precise control over how Pardinus interacts with the AI provider, how much data is shared, and what safeguards are in place before any analysis runs.
Provider Reliability A status banner shows the last provider test result with timestamp, confirming the AI endpoint is returning valid responses. The Require provider test before RCA toggle ensures that Pardinus verifies the provider connection is healthy before attempting any root cause analysis - preventing wasted time and confusing results if the AI backend is down. As a safety net, the Fallback to deterministic evidence only if AI fails option allows Pardinus to still deliver value using rule-based evidence gathering when the AI provider is unavailable.
Evidence and Context Control Administrators can fine-tune how much data Pardinus sends to the AI: the Max evidence items sent to AI caps the number of data points included in each analysis (e.g., 100), while the History window in hours defines how far back Pardinus looks when collecting event context (e.g., 24 hours). This balances analysis depth against token usage and cost.
Data Privacy – Redaction Before AI The Redact sensitive values before AI toggle is a critical privacy feature: when enabled, Pardinus sanitizes outbound payloads before they reach the AI endpoint, stripping sensitive information like hostnames, IPs, or other identifiable data. The AI payload redaction preview tool lets administrators generate a sample payload and inspect exactly what the AI will see after redaction is applied - full transparency, no guesswork about what data leaves the environment.
Quality and Transparency The High confidence threshold (e.g., 0.75) defines the minimum score for an RCA result to be flagged as “HIGH confidence,” giving teams control over what standard of certainty they expect. The Show provider used in RCA result toggle controls whether the model and endpoint details are visible in each report, supporting audit and compliance requirements.
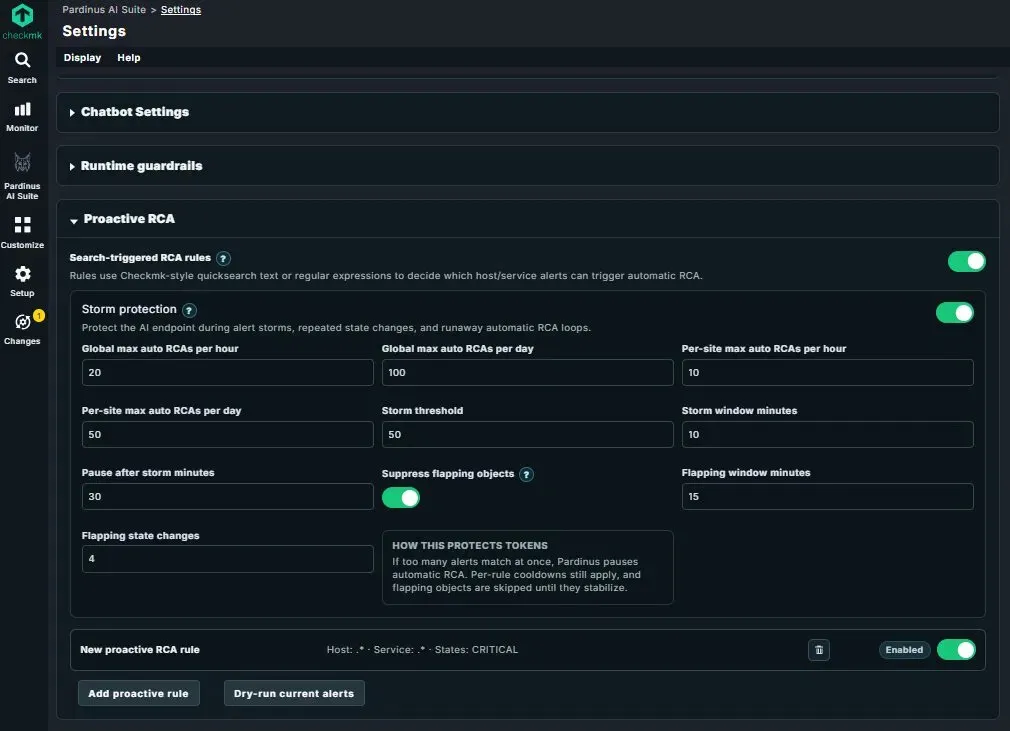
Proactive RCA – Automatic Root Cause Analysis with Built-In Storm Protection Pardinus can go beyond on-demand analysis and run RCA proactively, triggered automatically when alerts match predefined rules. The Search-triggered RCA rules use Checkmk-style quicksearch text or regular expressions to define which host/service alert combinations should trigger automatic analysis. Rules can be scoped by host pattern, service pattern, and alert state (e.g., CRITICAL only), and each rule can be individually enabled or disabled.
At the bottom of the section, the “Add proactive rule” button lets administrators create new rules, while “Dry-run current alerts” allows testing rules against the live alert queue before enabling them - so teams can validate the scope and expected volume without triggering any actual AI calls.
Storm Protection – Safeguard Against Runaway Costs When automating RCA, alert storms and flapping services can quickly escalate token consumption. Pardinus includes a comprehensive Storm Protection system with multiple layers of defense:
Rate limiting is configurable at both global and per-site levels, with separate caps for hourly and daily automatic RCA runs (e.g., 20/hour and 100/day globally, 10/hour and 50/day per site). This ensures that even in a distributed multisite environment, no single site can consume a disproportionate share of AI resources.
The storm detection mechanism monitors alert volume within a configurable time window (e.g., 50 alerts in 10 minutes). When a storm is detected, Pardinus pauses automatic RCA for a defined cooldown period (e.g., 30 minutes), protecting the AI endpoint and the budget from burst activity.
Flapping suppression adds another layer of intelligence: services that change state too frequently (e.g., 4 state changes within 15 minutes) are automatically excluded from automatic RCA until they stabilize. This prevents Pardinus from wasting tokens analyzing services that are bouncing between states and don’t yet have a stable problem to diagnose.
As the built-in explanation puts it: if too many alerts match at once, Pardinus pauses automatic RCA, per-rule cooldowns still apply, and flapping objects are skipped until they stabilize. Every layer works together to ensure proactive analysis is both powerful and cost-safe.
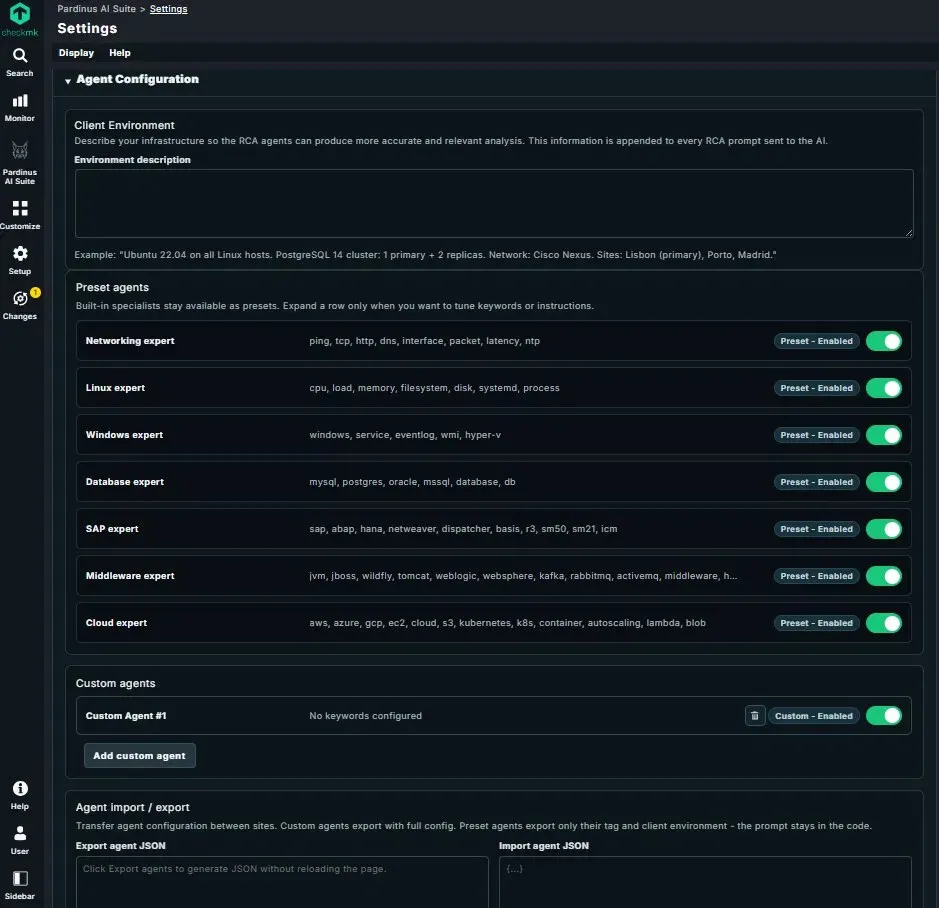
Agent Configuration – Specialist AI Agents Tailored to Your Stack Pardinus uses a system of specialist AI agents, each trained with domain-specific knowledge and keywords to handle different areas of your infrastructure. The Agent Configuration page lets administrators control which specialists are active and customize them to match the environment.
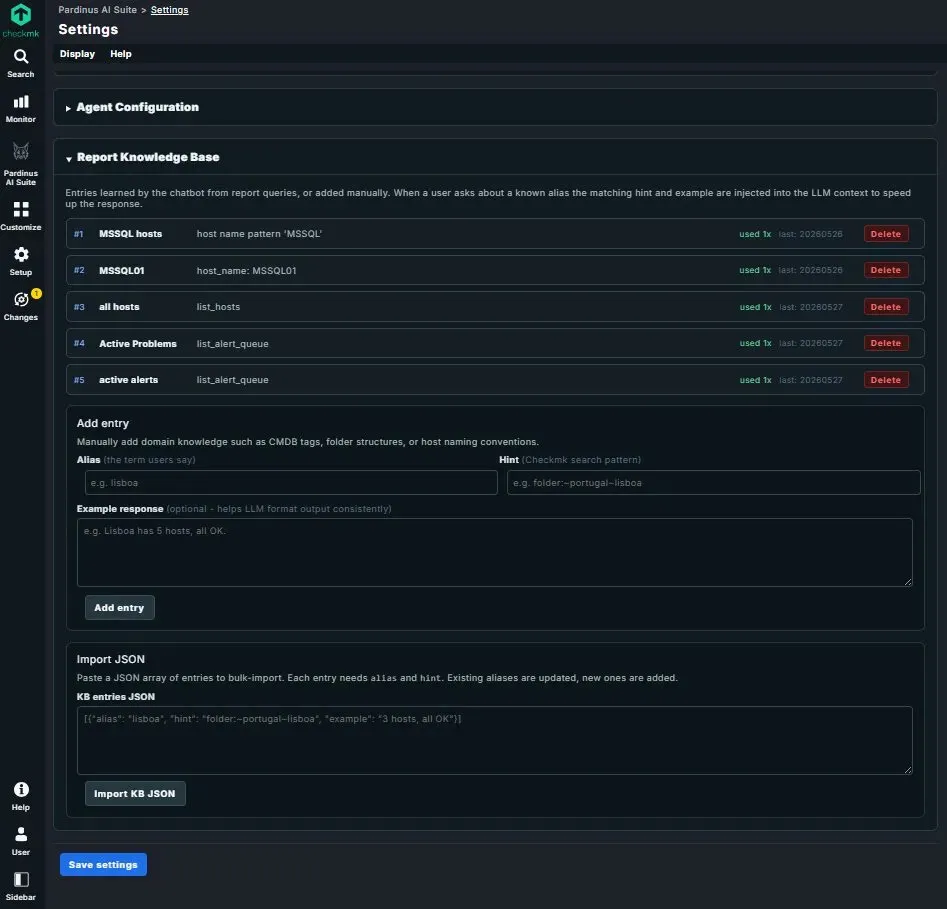
Report Knowledge Base – Teach Pardinus Your Environment’s Language The Report Knowledge Base is where Pardinus learns the domain-specific vocabulary and shortcuts unique to your organization. Entries are either learned automatically by the chatbot from previous report queries, or added manually by administrators. When a user asks about a known alias, the matching hint and example response are injected into the AI context — speeding up responses and improving accuracy.
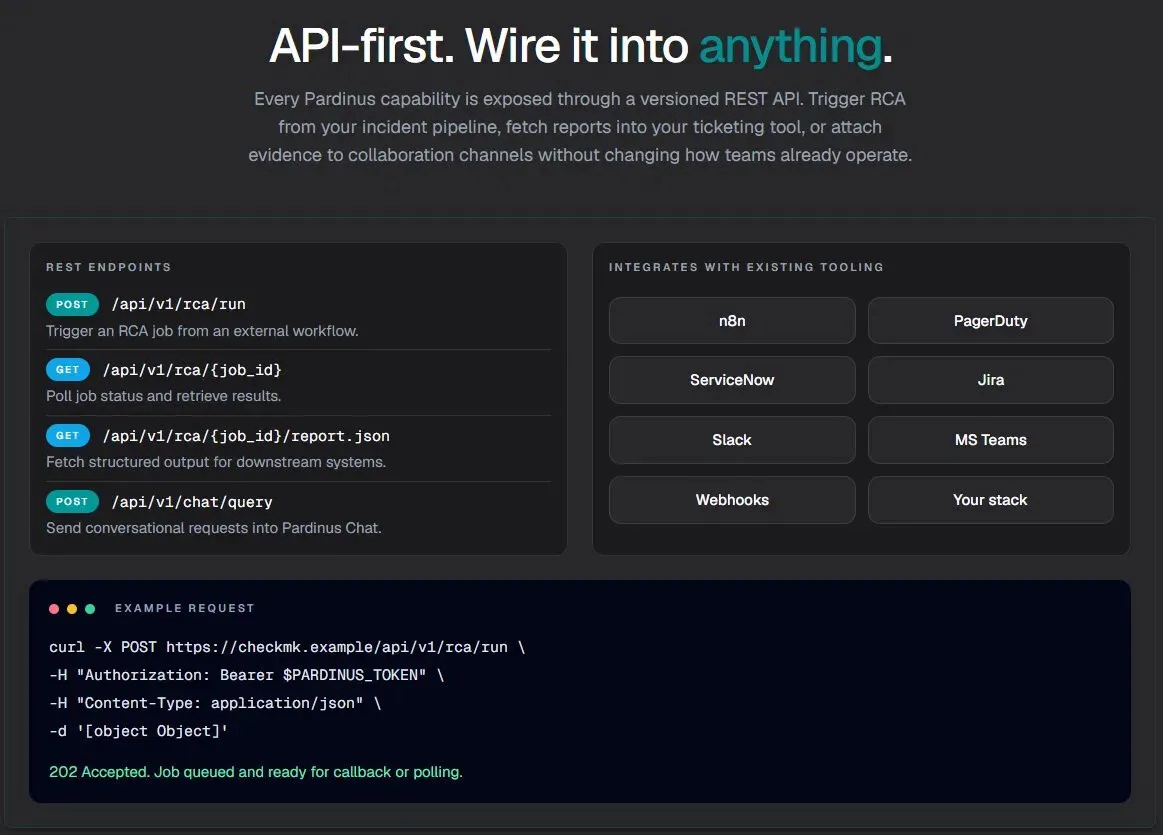
API-First – Wire Pardinus Into Anything Every Pardinus capability is exposed through a versioned REST API, making it a first-class citizen in any incident management workflow. Teams can trigger RCA from their existing pipelines, fetch structured reports into ticketing systems, or push evidence to collaboration channels — all without changing how they already operate.
And … This is just the beginning.
Pardinus AI Suite is actively evolving - new specialist agents, deeper integrations, and more autonomous capabilities are on the roadmap. Every feature you’ve seen in this article is running in production today, on real Checkmk environments, solving real incidents.
If this resonates with the challenges your team faces - alert fatigue, slow triage, inconsistent diagnostics, or simply wanting to get more value out of your monitoring investment — I’d love to hear from you.
Whether you’re running a small Checkmk setup or managing a complex multisite enterprise deployment, whether you’re curious about a specific feature or want to see Pardinus in action on your own alerts - let’s talk.
Drop me a message here on LinkedIn, or reach out directly. I’m always happy to walk through a live demo, discuss how Pardinus fits into your stack, or simply exchange ideas about where AI-driven operations is heading.
The alerts aren’t going to diagnose themselves. But now, they can.