The Day I Realized Observability Stops Too Early
A few months ago I was reading about air pollution levels in New Delhi. During some winter weeks, PM2.5 concentrations can reach 200-300 µg/m³, sometimes even higher. The World Health Organization recommends staying below 15 µg/m³ as a daily average. That’s not a small difference. That’s more than ten times the recommended level.
When pollution peaks there, schools close, flights get delayed, and people are advised to stay indoors. It’s a public health problem affecting millions of people. At the same time, in the world I work in, we obsess over metrics.
We monitor CPU usage every minute. We track memory pressure, disk I/O, network latency. We trigger alerts if a service responds 300 milliseconds slower than usual. And that contrast kept bothering me.
We have incredibly advanced tools to observe systems. Entire teams are dedicated to building monitoring pipelines, alerting strategies, dashboards and incident response workflows. But somehow, the air people breathe every day rarely enters those systems.
The data exists. Thousands of monitoring stations measure pollutants continuously around the world. It’s just… disconnected from the operational tools we use. That thought eventually led me to build a small experiment.
Treating Air Quality Like Infrastructure
I built a Special Agent for Checkmk that integrates with the OpenAQ API v3.
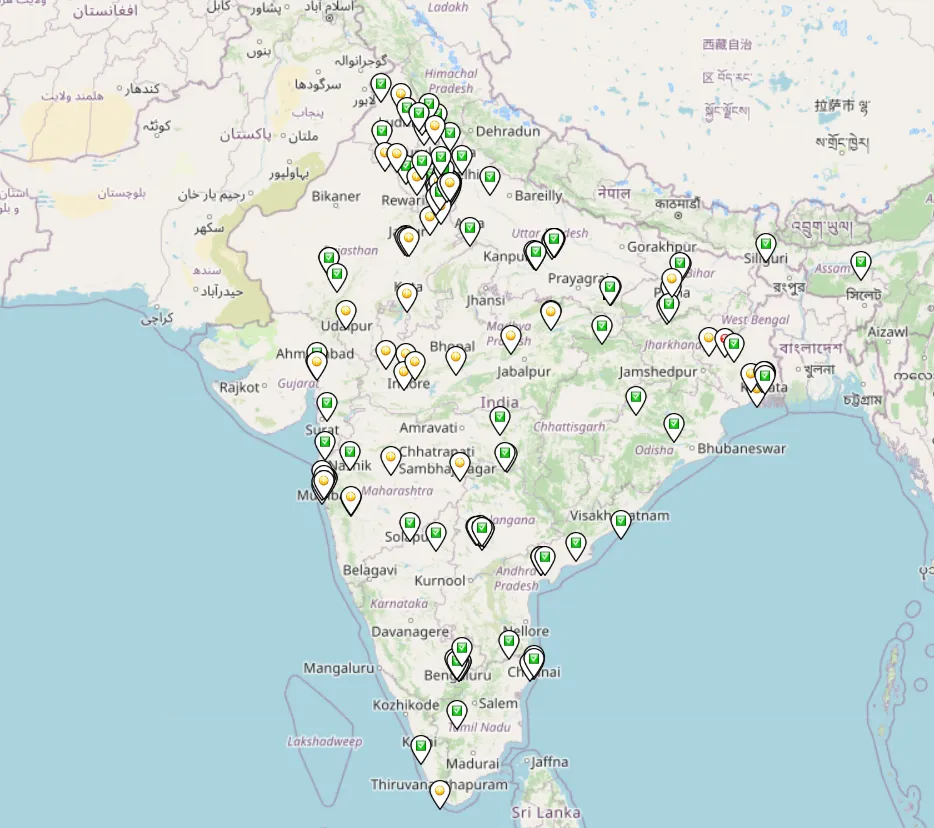
OpenAQ aggregates environmental measurements from monitoring stations across the world. Instead of keeping that data inside external dashboards, the agent pulls it directly into the monitoring stack.
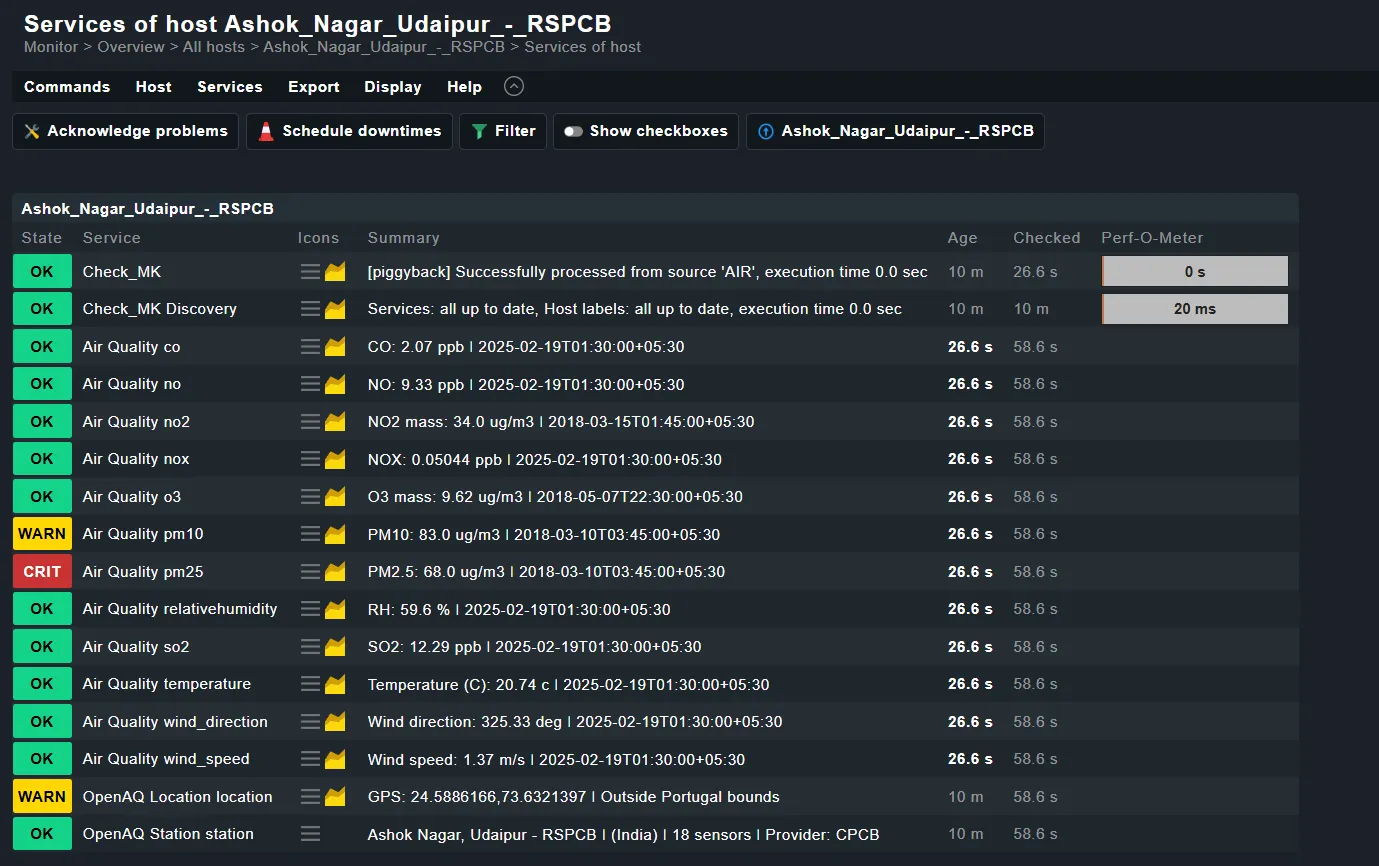
Each station becomes a host inside Checkmk.
Each pollutant becomes a service:
- PM2.5
- PM10
- O₃
- NO₂
- SO₂
Thresholds are based on WHO and EPA air quality guidelines, so the monitoring system can classify measurements as OK, WARN or CRIT just like any other metric.
From the monitoring perspective, it behaves exactly like infrastructure monitoring. Except the signal isn’t coming from a server. It’s coming from the physical environment.
Why This Matters
One of the things I like about monitoring systems is that they force us to treat signals seriously.
A number on a dashboard might be interesting. A monitored service with a defined threshold becomes actionable. Once something enters the monitoring workflow, it stops being abstract. It becomes something you observe, react to, and learn from.
Air quality data deserves that level of attention. Cities dealing with pollution problems, research institutions studying environmental impact, or even organizations interested in environmental awareness could benefit from integrating these signals into their operational systems.
Monitoring doesn’t have to stop at servers. Sometimes the most important metric isn’t CPU usage. Sometimes it’s the air people breathe.