As modern enterprises embrace increasingly complex integration architectures, observability is no longer a luxury - it’s a non-negotiable. At Lynxmind, we’ve spent years helping organizations operate mission-critical systems. And over time, one challenge kept surfacing:
A lack of deep, real-time visibility into MuleSoft environments. Not because the tools didn’t exist. But because none of them understood MuleSoft the way it needs to be understood.
That’s why we didn’t build this plugin out of necessity. We built it because we saw the necessity. And because we knew how to solve it.
The problem with monitoring MuleSoft
MuleSoft’s power lies in its flexibility. Whether running on CloudHub, on-prem, or hybrid environments, it enables scalable integrations across ecosystems. But this same flexibility introduces complexity.
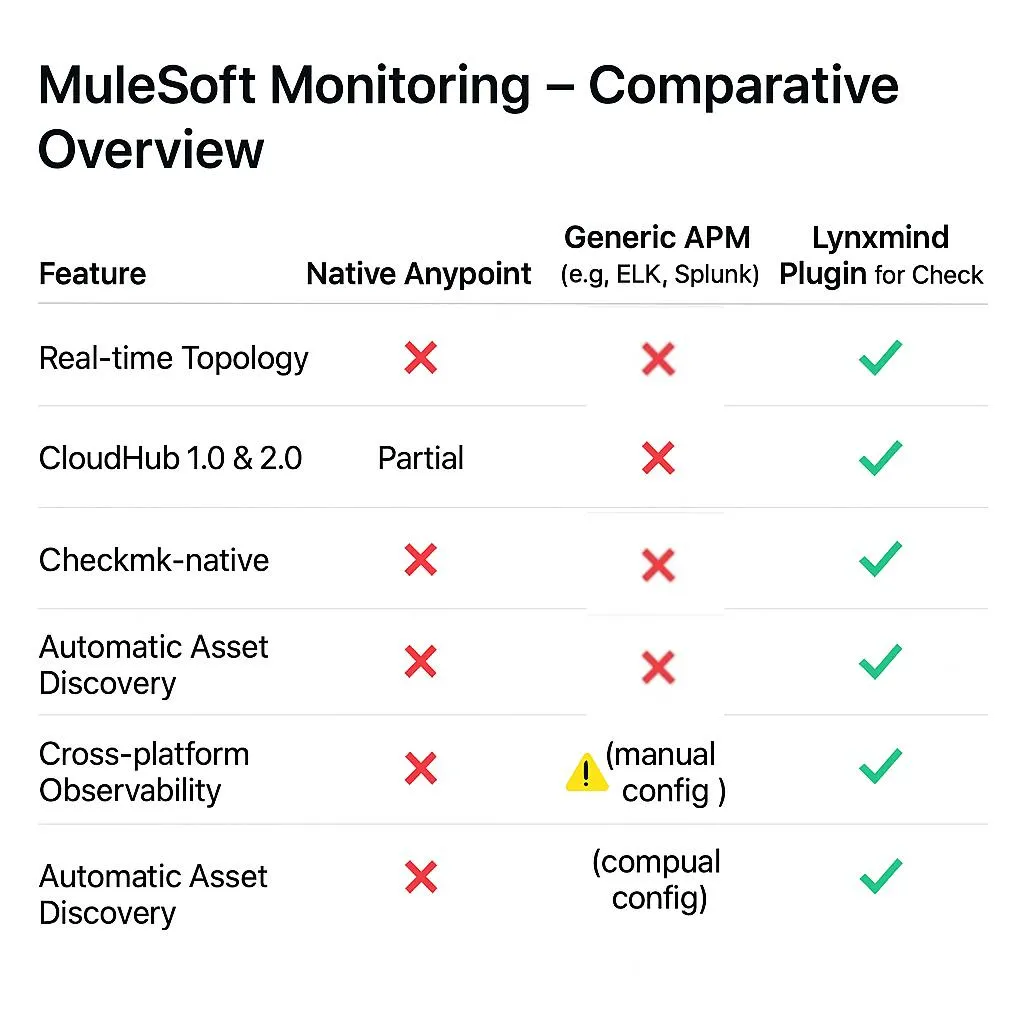
Monitoring tools that aren’t purpose-built for MuleSoft typically:
- Offer limited asset discovery
- Fail to map dynamic topologies
- Miss key health and performance metrics
- Don’t differentiate between CloudHub 1.0 and 2.0
This leaves ITOps teams blind to infrastructure drifts, resource constraints, and failed deployments—until it’s too late.
Why we chose Checkmk
When designing this plugin, we weren’t just thinking about MuleSoft. At Lynxmind, we work across a wide range of enterprise systems - SAP, TIBCO, cloud services, on-prem infrastructure, and more. We needed a solution that could unify these layers into a single observability view. A solution that doesn’t just monitor isolated systems, but ties them together.
That’s why we chose Checkmk. Its lightweight architecture, plugin extensibility, and hybrid visibility model made it the ideal Foundation - not just for MuleSoft monitoring, but for true end-to-end observability.
Unlike “black box” platforms, Checkmk gives us the flexibility to:
- Build custom logic for specific platforms
- Correlate signals across disparate environments
- Maintain performance and control at scale
In short, it allows us to monitor the entire integration ecosystem, not just pieces of it.
What our MuleSoft plugin delivers
We designed the plugin to offer full-spectrum monitoring of MuleSoft environments.
Automatic Discovery
- Organizations & Environments
- Runtimes & Applications
- Queues & Exchanges
- Licenses
- Dedicated Load Balancers (DLBs)
- VPCs & Transit Gateways
- System Inventory
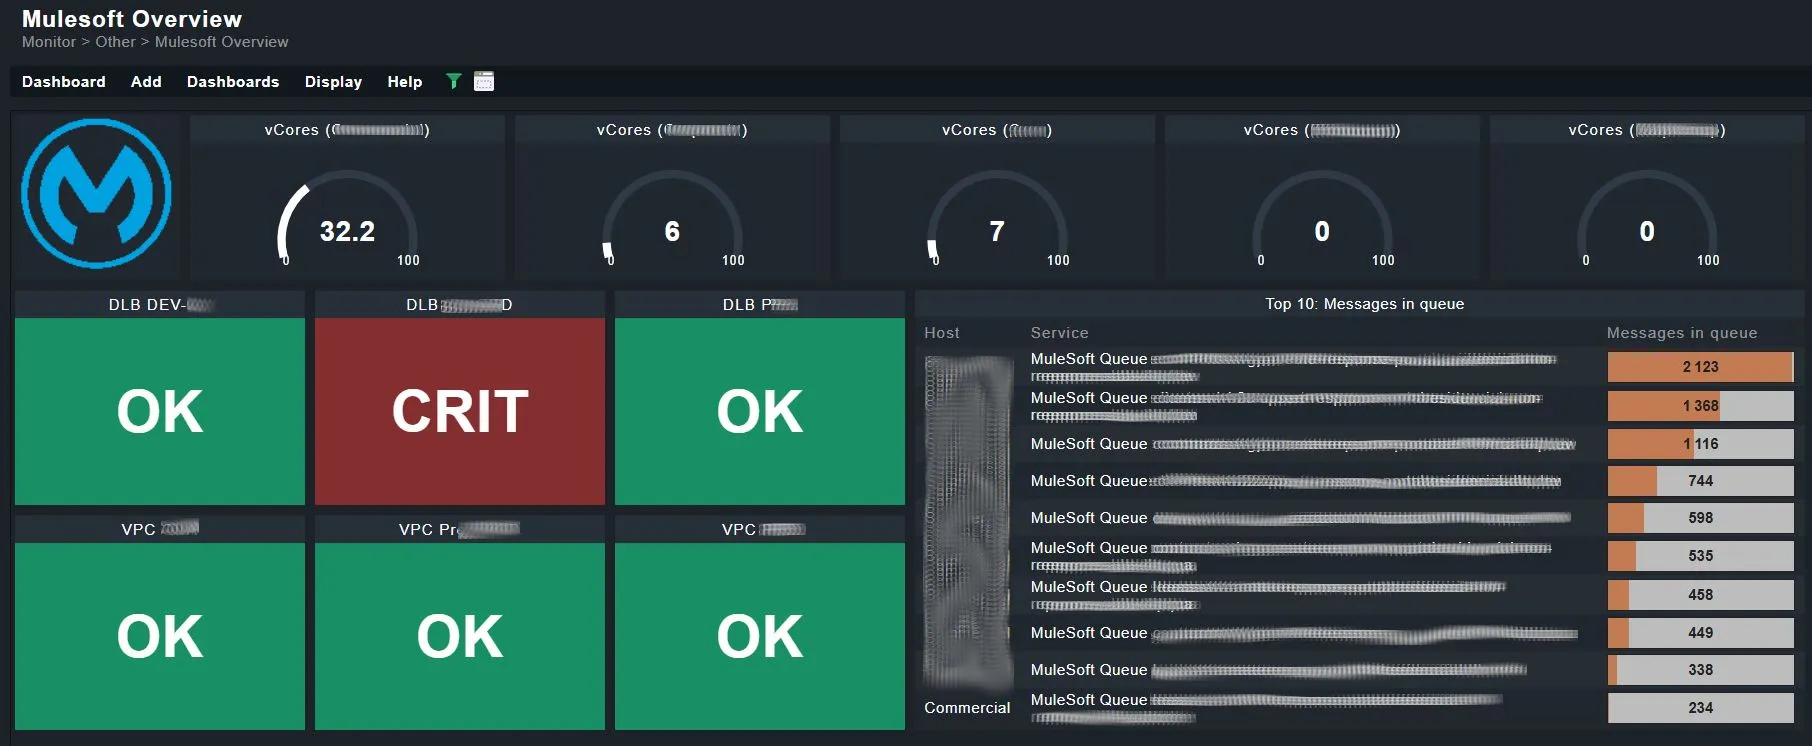
Real-Time Metrics
We track 20+ health and performance indicators across layers—CPU, memory, queue depth, error rates, and more.
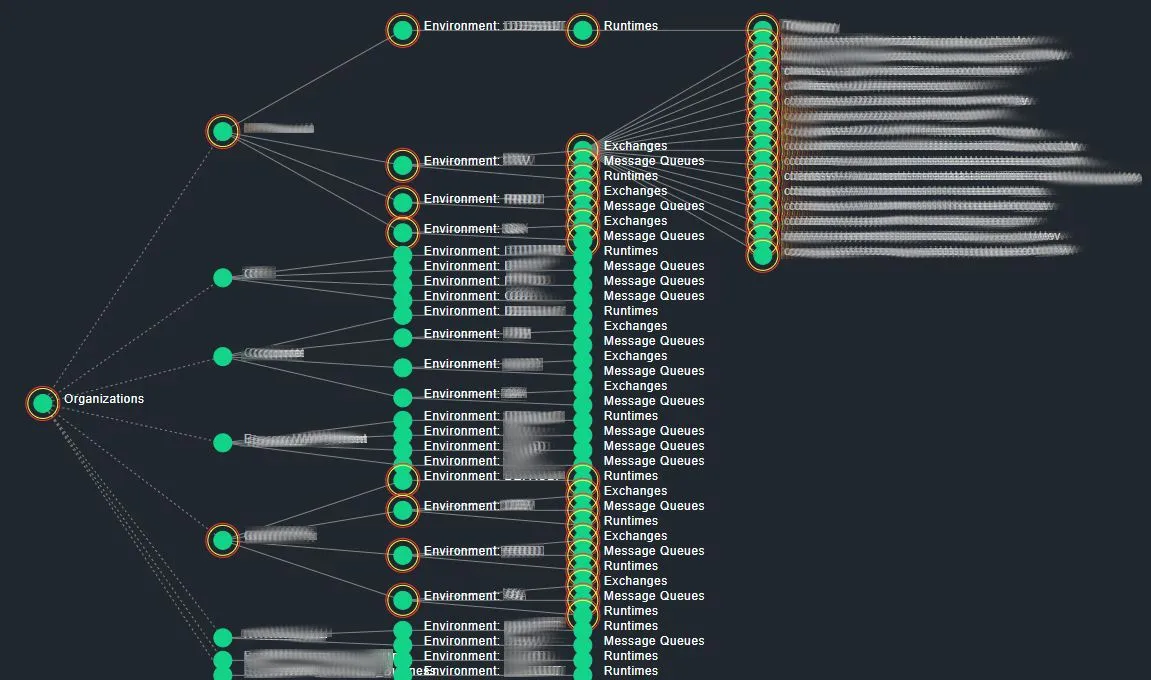
Topology Mapping
Visualize how components connect and interact directly inside Checkmk. This isn’t just pretty—it’s actionable.
CloudHub 1.0 and 2.0 Support
Many organizations are in the middle of a migration. Our plugin supports both versions natively, so you maintain full observability throughout.
How we built it
We took an API-first, modular approach. Using MuleSoft’s REST APIs, we developed discrete data collectors for each layer of the environment. These are orchestrated within Checkmk using its powerful plugin framework.
Performance was a top priority - we implemented caching, throttling, and error handling mechanisms to ensure the plugin scales smoothly even in large, complex deployments. We also built it for the future. As MuleSoft evolves, this plugin is designed to evolve with it.
Real-world impact
In early deployments, our plugin has already made a measurable difference:
- Reduced incident resolution time by 43%
- Helped teams detect underutilized or orphaned runtimes
- Enabled proactive alerting before SLAs were breached
Whether you’re running 10 apps or 1,000, that level of insight matters.
What’s next
We’re currently finalizing the first public release.
Coming soon:
- Advanced alerting strategies
- Custom dashboards and visualizations
- Integrations with ServiceNow, Jira, and other tools
- Open-sourcing key components for community contribution
Final thoughts
Observability isn’t about dashboards—it’s about control.
With this MuleSoft plugin, our goal was to bridge the visibility gap in modern integration ecosystems. But more than that, we wanted to make end-to-end observability practical and actionable.
And this is just the beginning.
Want a demo? A technical deep dive? Or to collaborate with us? Get in touch. We’d love to hear from you.
Found this useful? Share it with your ITOps or DevOps team.